この節の作者: Sebastian Jentschke
From SPSS to jamovi: t-test for paired samples
After having demonstrated the beneficial effect of repeated-measures-designs on the standard error of mean, we conduct a t-test for paired samples. Using this test, we compare whether the number of mischieveous acts has increased after receiving a cloak of invisibility (variableCloak) in comparison to the number of mischieveous acts at baseline (variableNo_Cloak). This analysis is described in chapter 10.9.3 of Field (2017), especially Figure 10.12 and Output 10.8 - 10.9. We use the same data set Invisibility RM.sav which can be downloaded from the web page accompanying Andy Field's book.
| SPSS | jamovi |
|---|---|
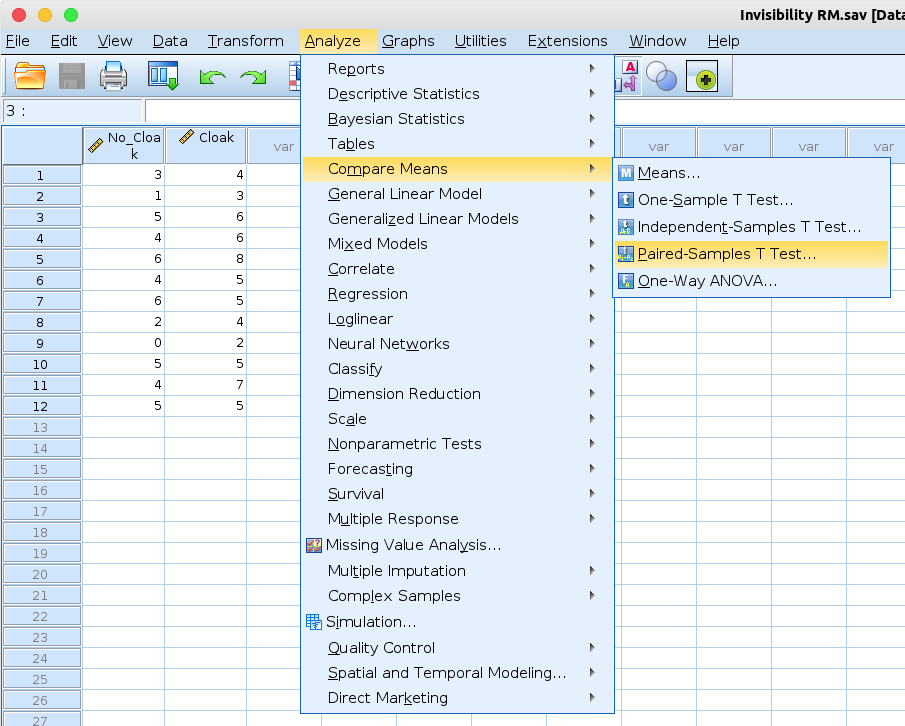
In SPSS you can set up a t-test for paired samples using: Analyze →
Compare means → Paired Samples T-Test. |
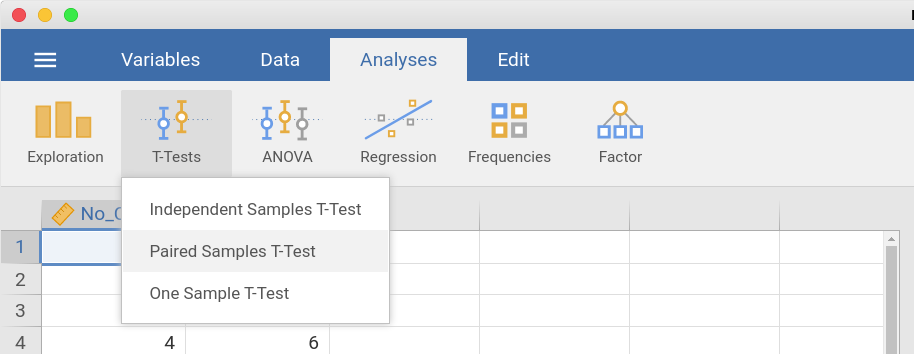
In jamovi you do this using: Analyses (tab) → T-Tests → Paired
Samples T-Test |
 |
 |
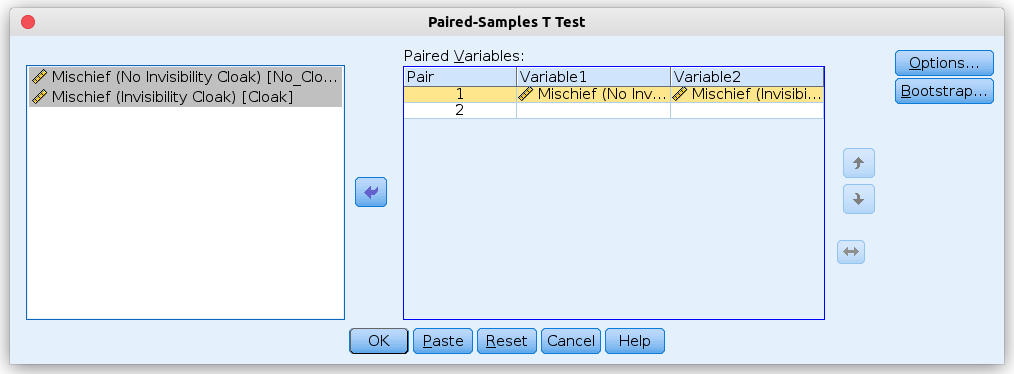
In the input window that opens, the two variables No invisibility cloak
and Invisibility cloak are assigned to the field Paired variables. |
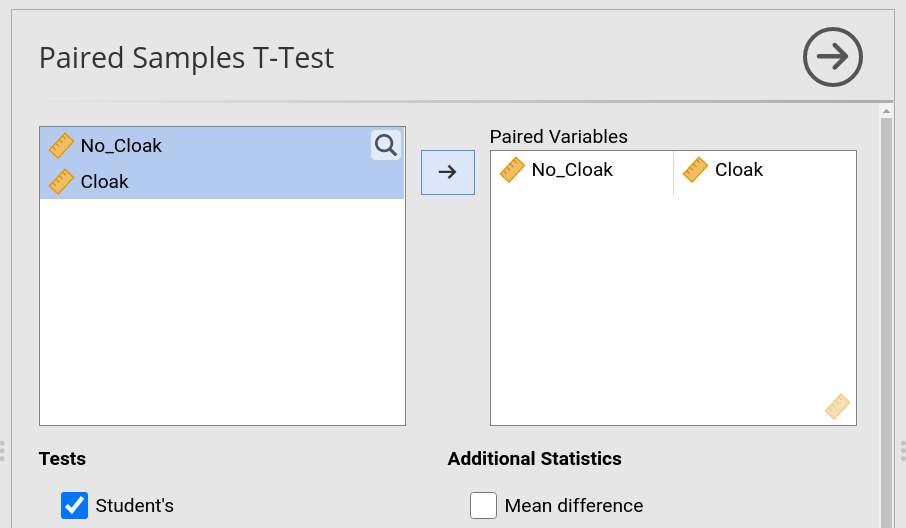
In the input panel that opens, the variables No_Cloak and Cloak are
moved to the variable input box Paired Variables. |
 |
 |
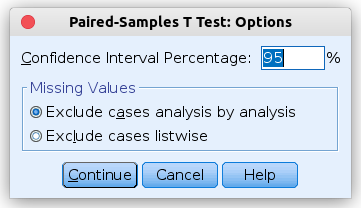
Afterwards, we press the Options button to set the confidence interval
to 95%. We, furthermore, select Exclude cases analysis by analysis
(however, the latter setting only matters if we compare two pairs of
variables and if those two pairs differ in for which participant those
missing values occur). |
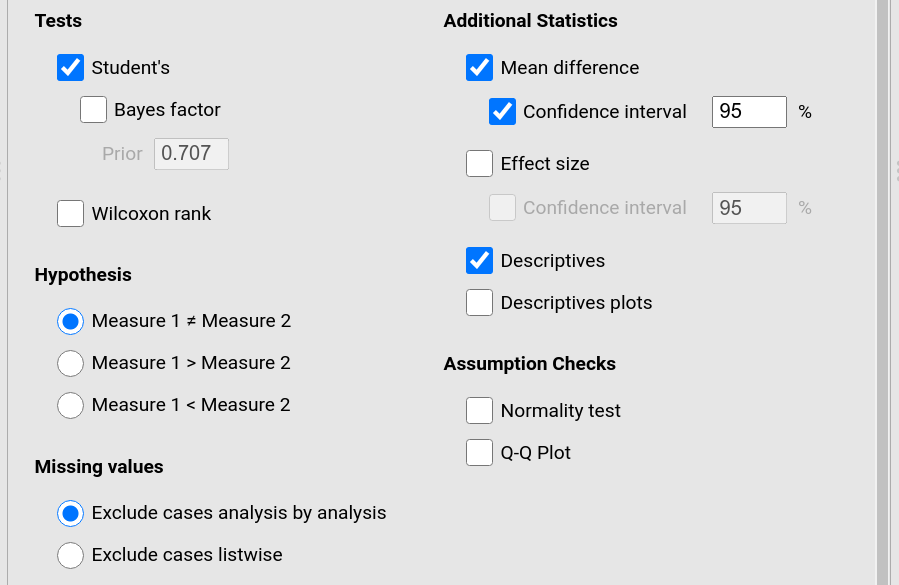
In jamovi, do we go further down in the input panel and tick Mean
Difference and its Confidence interval underneath. We, furthermore,
tick Descriptives to obtain a output that is similar to SPSS. Finally, we
set the radio box to Exclude cases analysis by analysis (the same comment
as for SPSS applies; the setting won't matter unless we compare at least two
pairs of variables differing in which participants have missing values). |
 |
 |
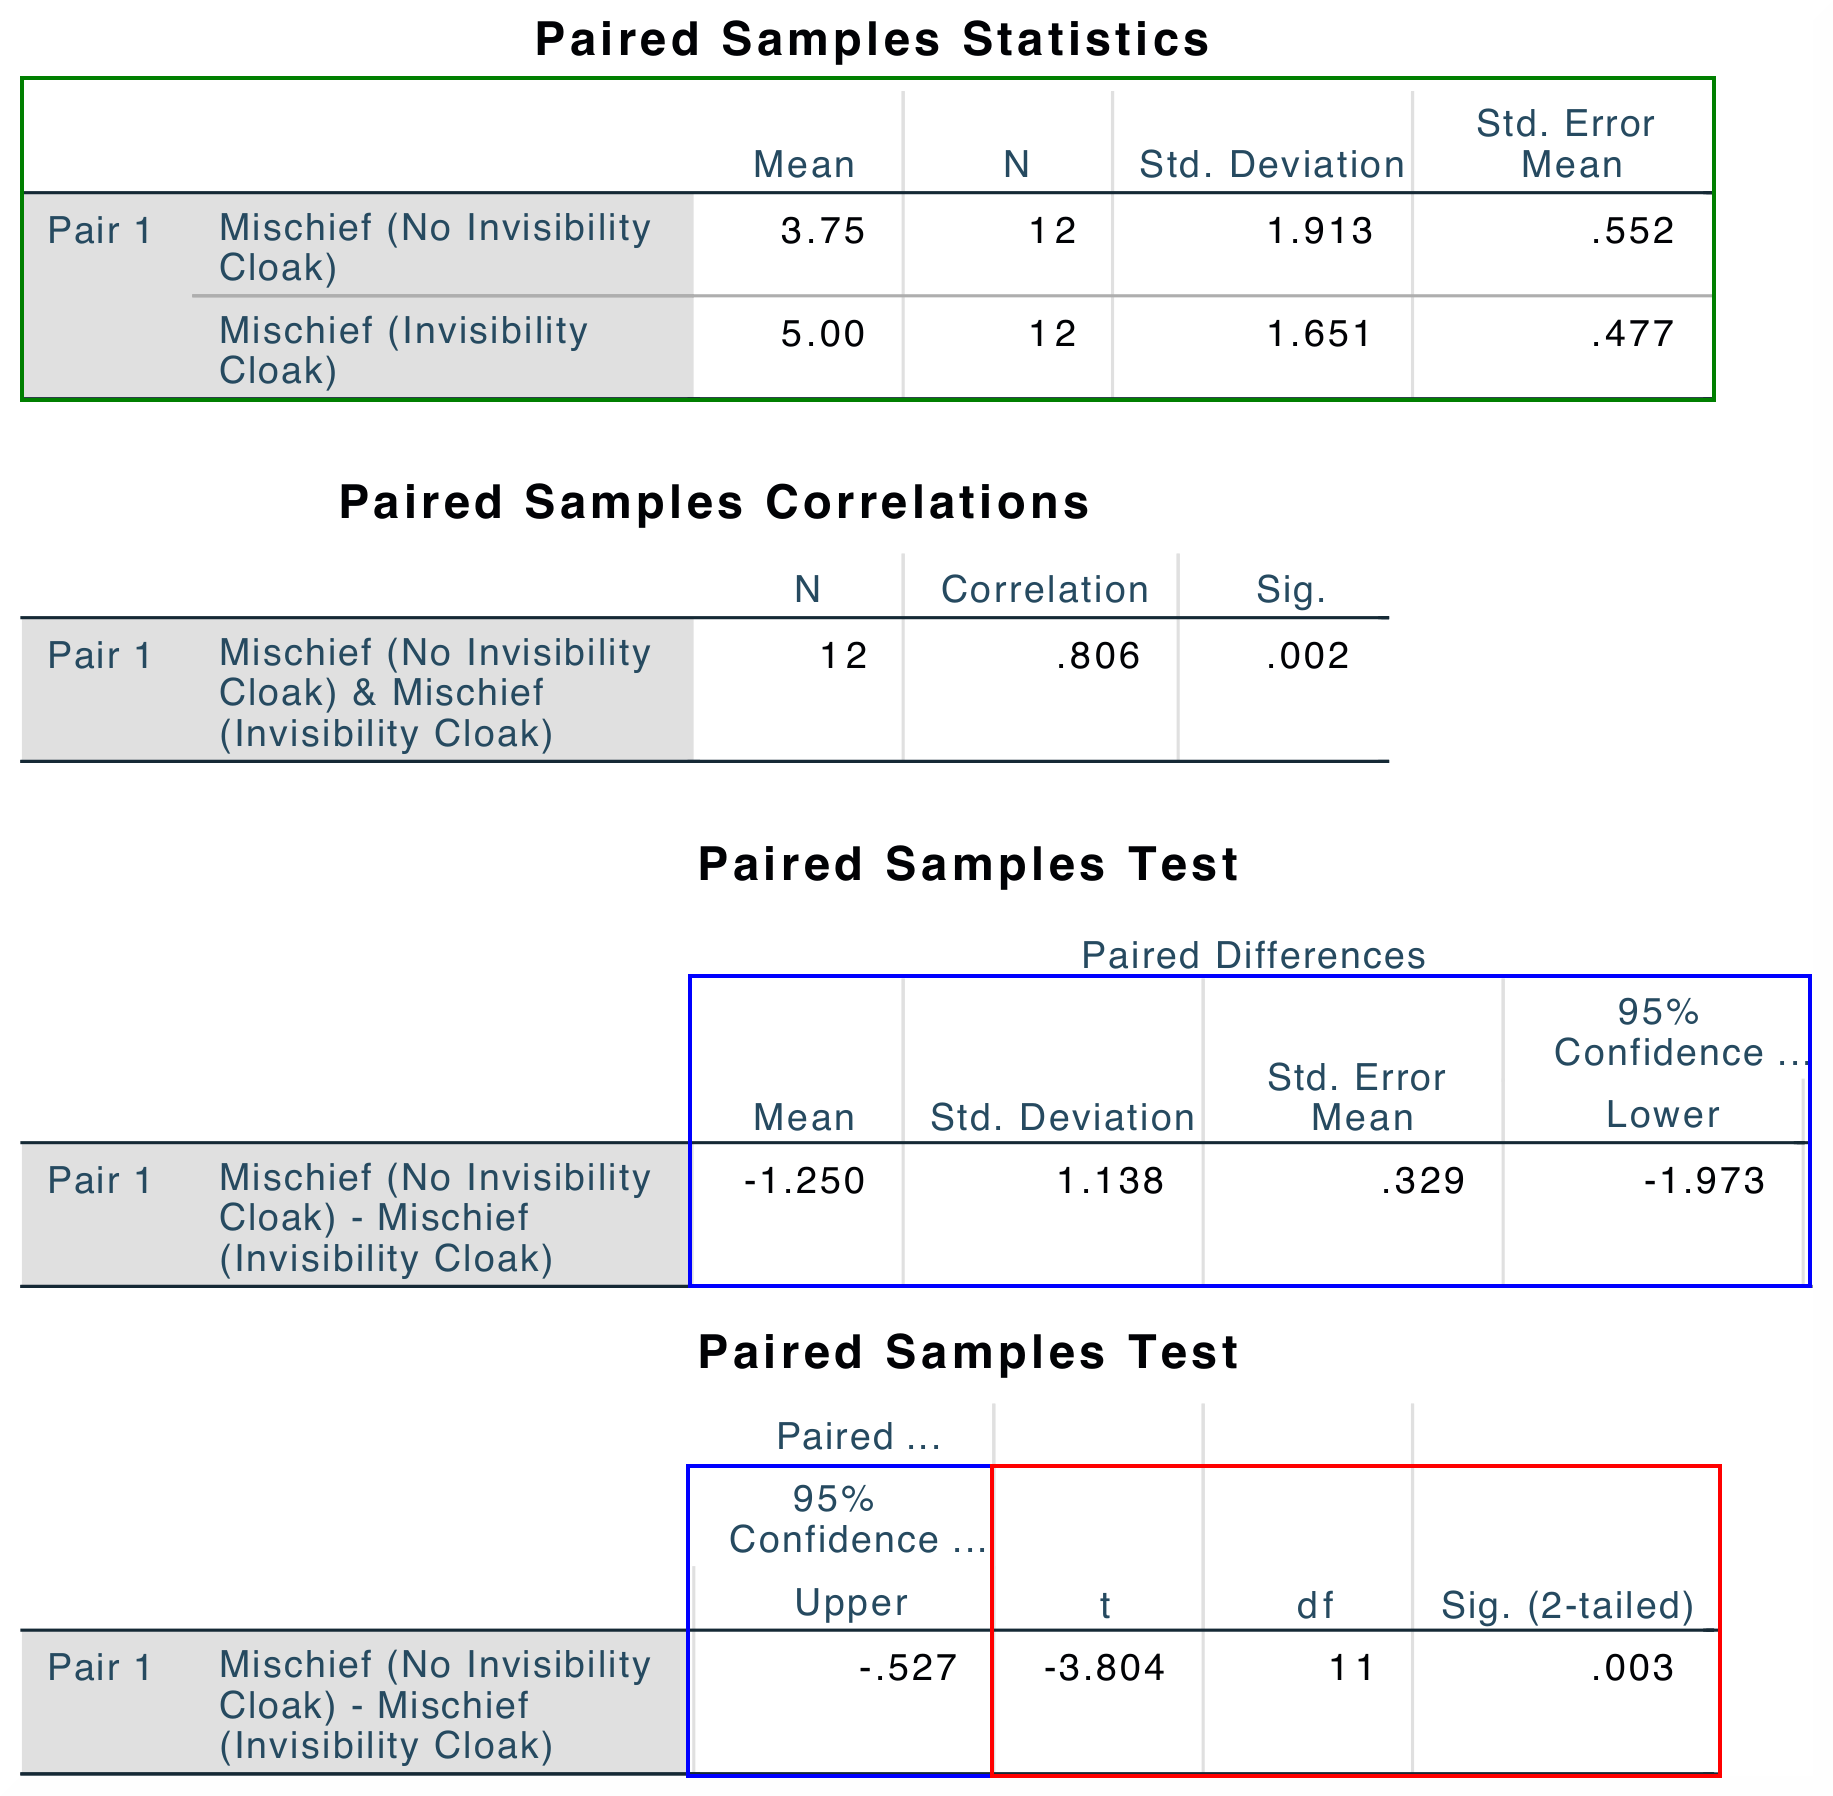
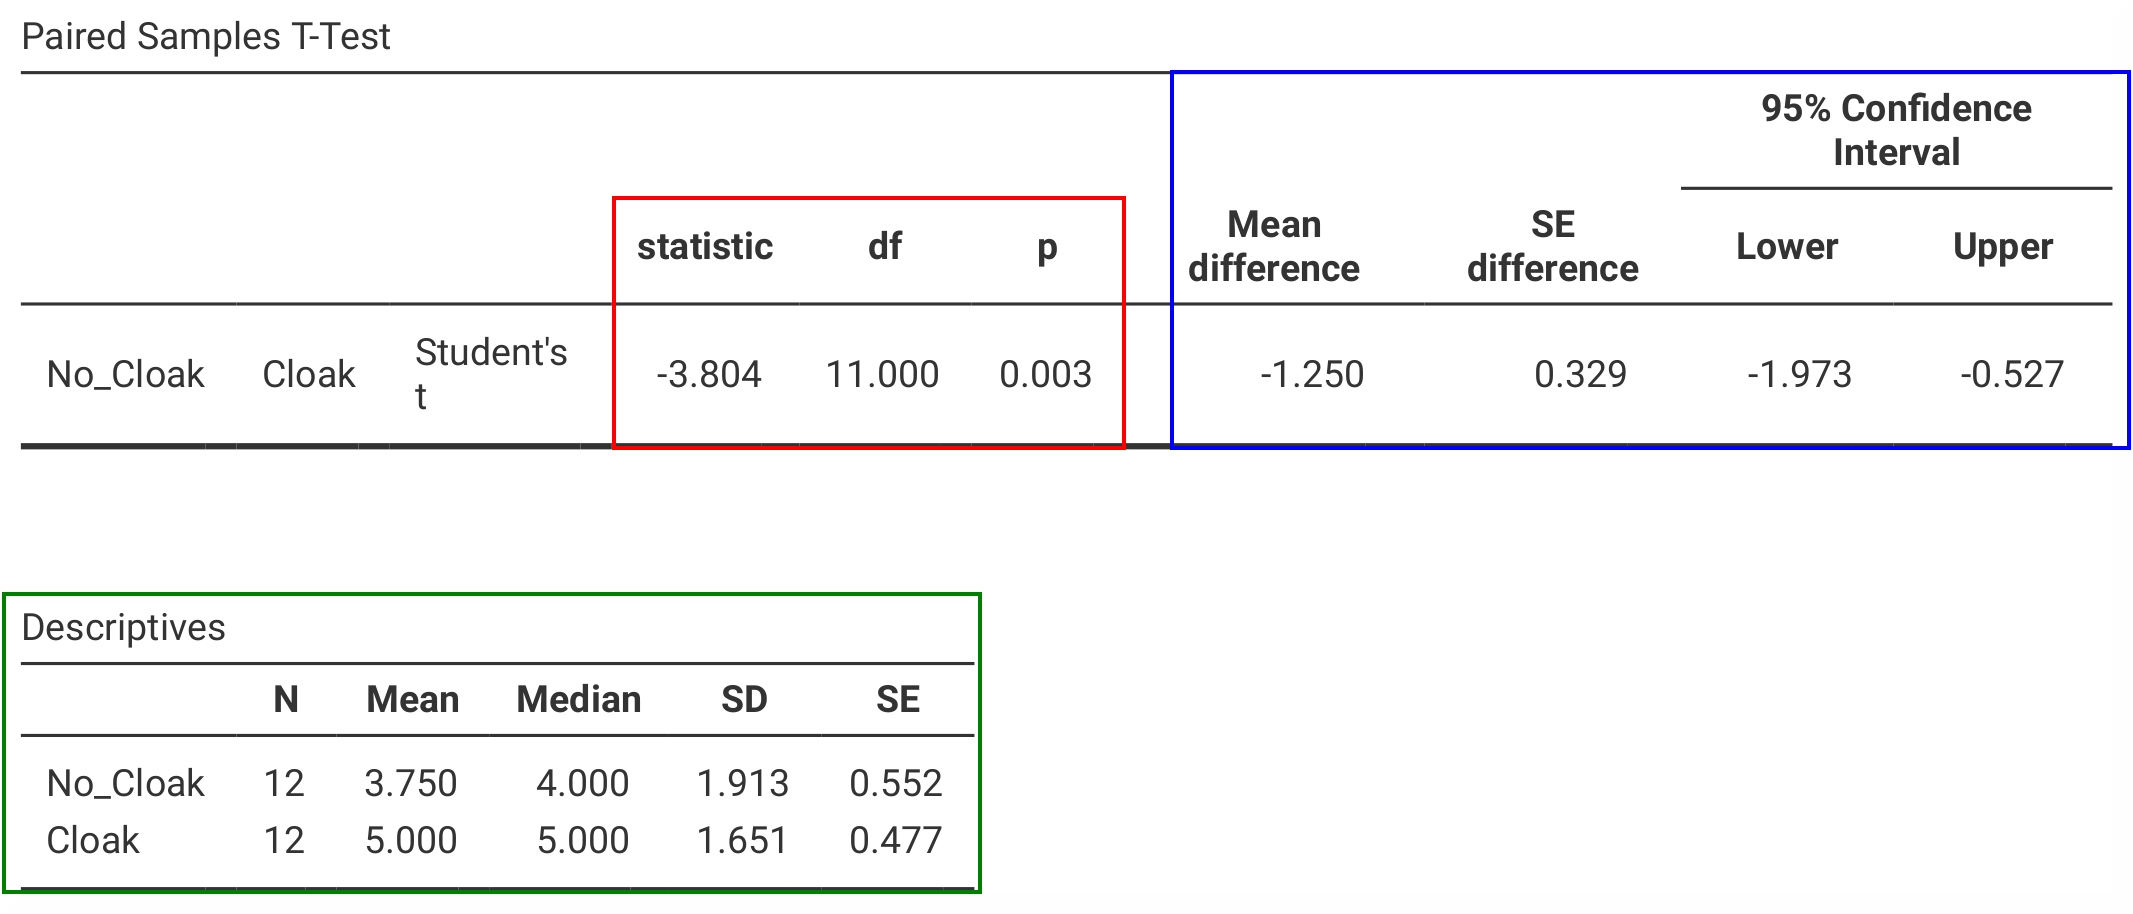
The results from SPSS and jamovi are identical, but they are arranged slightly differently. SPSS gives the mean difference (blue box) first, before giving
the t-statistics and their respective degrees of freedom and p-value (red box), in jamovi it is the other way round (statistics – red box – first and mean
difference – blue box – afterwards). Another table underneath (green box) gives the descriptive statistics for the two variables that were compared. Except
from that jamovi also reports the Median, and a slightly different way to arrange the columns (SPSS begins with the Mean and has the N afterwards,
jamovi vice versa) the two tables are identical.
The numerical values for the statistics are identical: t = -3.804, df = 11, p = 0.003. |
|
 |
 |
SPSS, in addition, gives the Paired Samples Correlation (which one
typically would not report). To obtain such table, one would have to use
Analyses (tab) → Regression → Correlation Matrix and assign the
variables No_Cloak and Cloak to the variable box. |
|
| If you wish to replicate those analyses using syntax, you can use the commands below (in jamovi, just copy to code below to Rj). Alternatively, you can download the SPSS output files and the jamovi files with the analyses from below the syntax. | |
T-TEST PAIRS=No_Cloak WITH Cloak (PAIRED)
  /CRITERIA=CI(.95)
  /MISSING=ANALYSIS.
|
jmv::ttestPS(
    data = data,
    pairs = list(
        list(
            i1="No_Cloak",
            i2="Cloak")),
    meanDiff = TRUE,
    ci = TRUE,
    desc = TRUE)
|
| SPSS output file containing the analyses | jamovi file with the analyses |
References
Field, A. (2017). Discovering statistics using IBM SPSS statistics (5th ed.). SAGE Publications. https://edge.sagepub.com/field5e