この節の作者: Sebastian Jentschke
From SPSS to jamovi: t-test for paired samples
This comparison shows how a t-test for independent samples is performed in SPSS and jamovi. As a first step, it demonstrates the calculation of the statistics underlying the t-test for paired samples. For this calculation, first, the average number of mischieveous acts for each person is calculated before a mean of these individual averages is calculated for the whole group. The individual is then adjusted for that group mean. The aim of this calculation is to show that by using repeated measurements, one can “control” for some proportion of the variance which is caused by individual differences in performance. In connection with this, the standard error of mean becomes smaller (which means that effects easier can become significant (as compared to a between-subjects design). This is described in chapter 10.9.2 of Field (2017), especially Figure 10.7 to 10.10.
It uses the data set Invisibility RM.sav which can be obtained from the web page accompanying the book. The data set describes a repeated-measures-design where first the “baseline”-number of mischieveous acts (during one week) is determined for each participant (variable
No_Cloak) before they are handed a cloak that makes them invisible. After receiving the cloak, the number of mischieveous acts is recorded for the following week (variableCloak) during which they can make themselves invisible (which is assumed to increase the number of mischieveous acts committed).
| SPSS | jamovi |
|---|---|
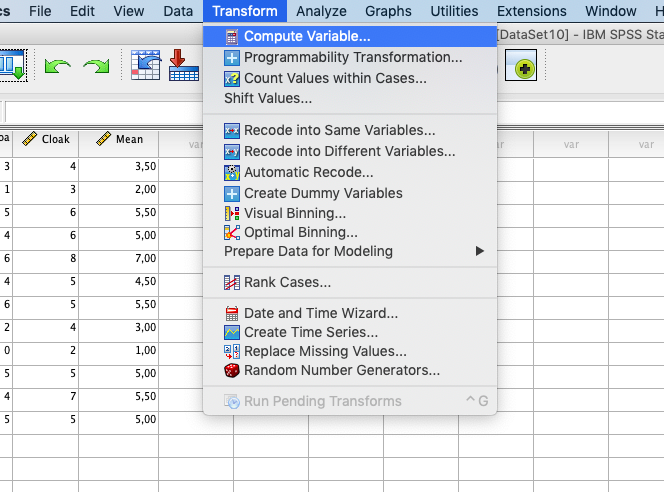
In SPSS you can create variables using: Transform →
Compute Variable... |
In jamovi you do this using: Data (tab) → Compute |
 |
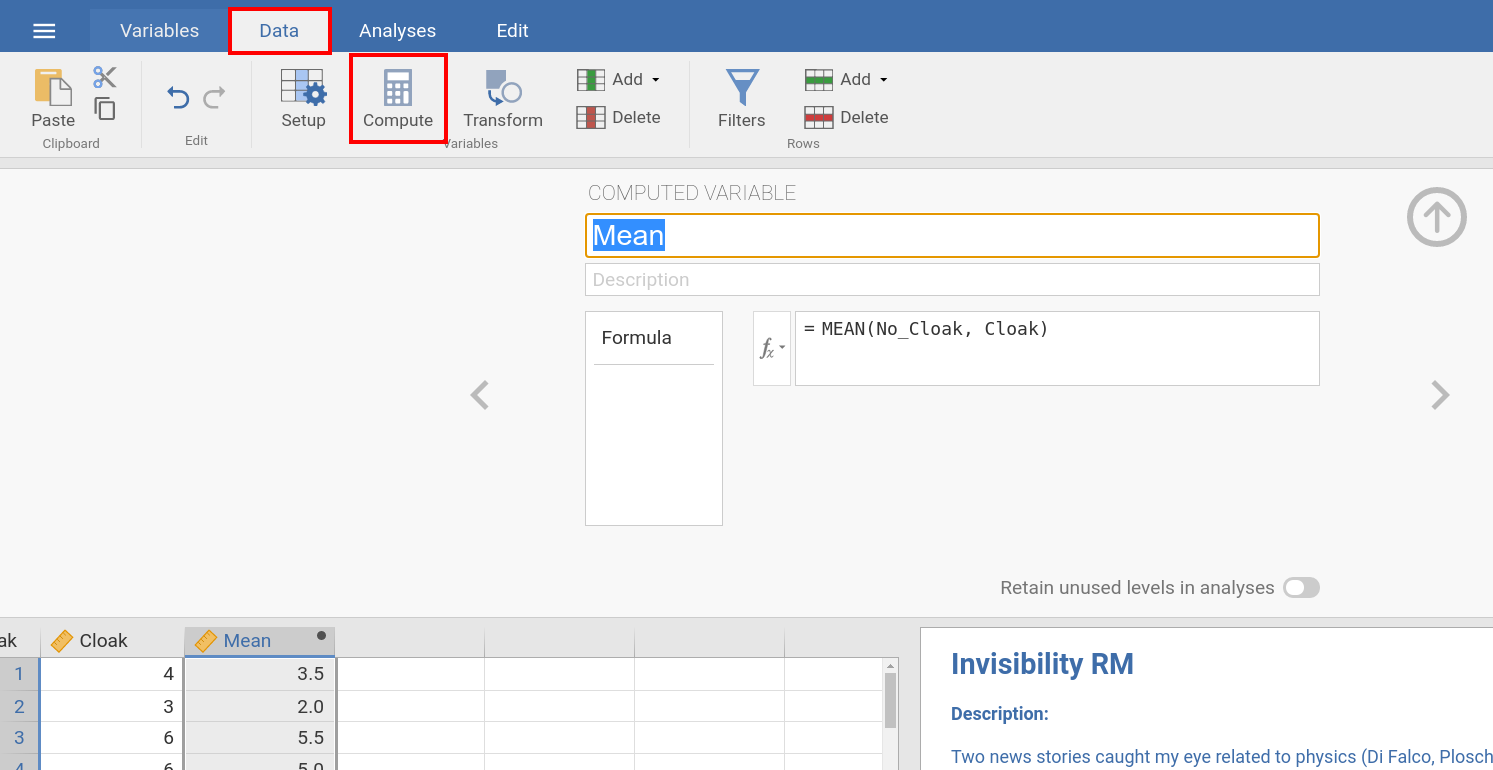 |
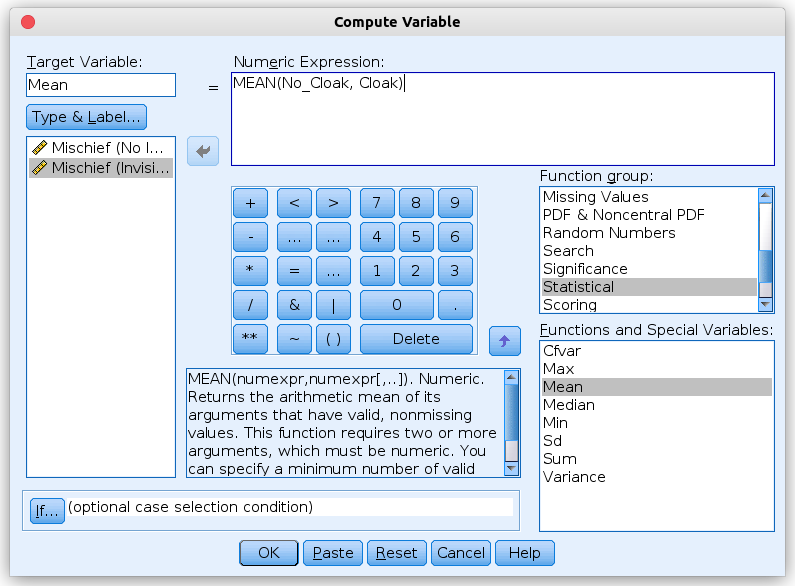
Both in SPSS and jamovi, you can calculate the average of the two columns No_Cloak and Cloak by using the calculation term MEAN(No_Cloak, Cloak)
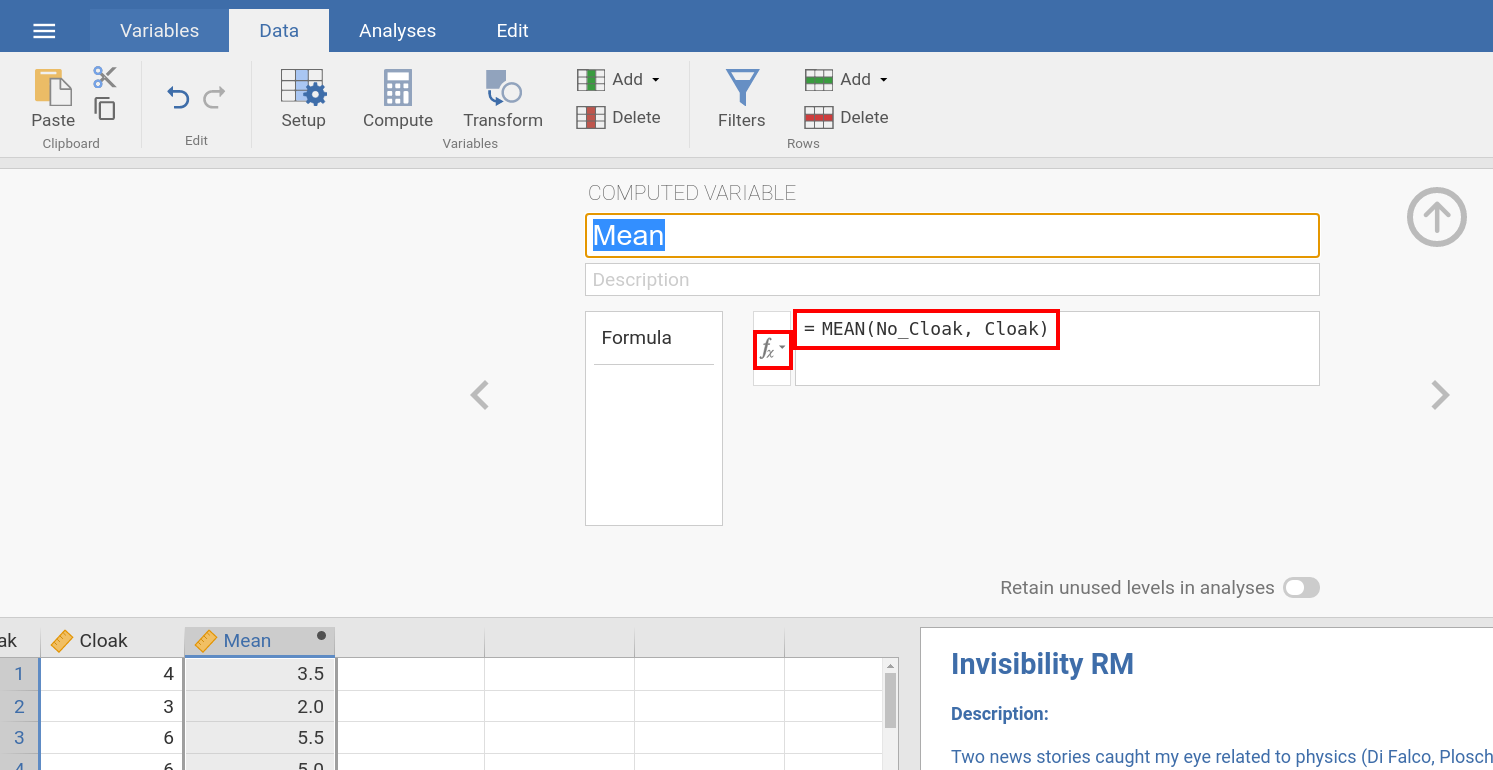
(as shown in the images below). Alternatively, you can choose the function to calculate the mean from the available functions (press fx in jamovi to open
a input window where you can select those functions). |
|
 |
 |
Now we would like to calculate the group mean for the individual means of the two conditions (No_Cloak and Cloak). To do this, we calculate
descriptive statistics. |
|
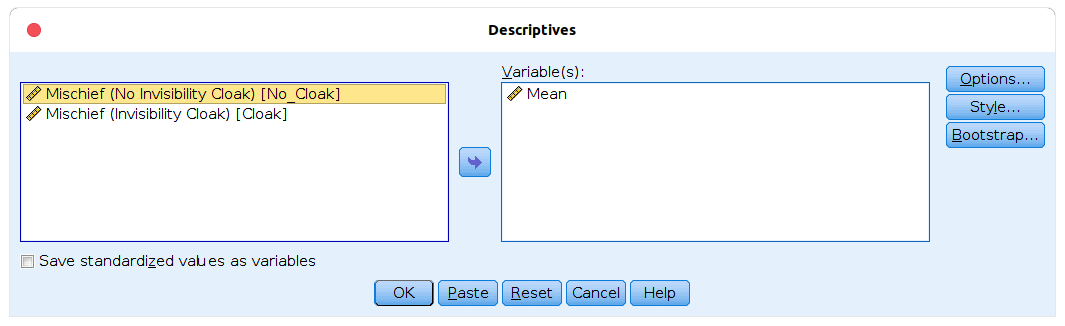
In SPSS this is done with: Analyze → Descriptive Statistics →
Descriptives. In the input window, you assign the variable with the
individual mean Mean to Variable(s). |
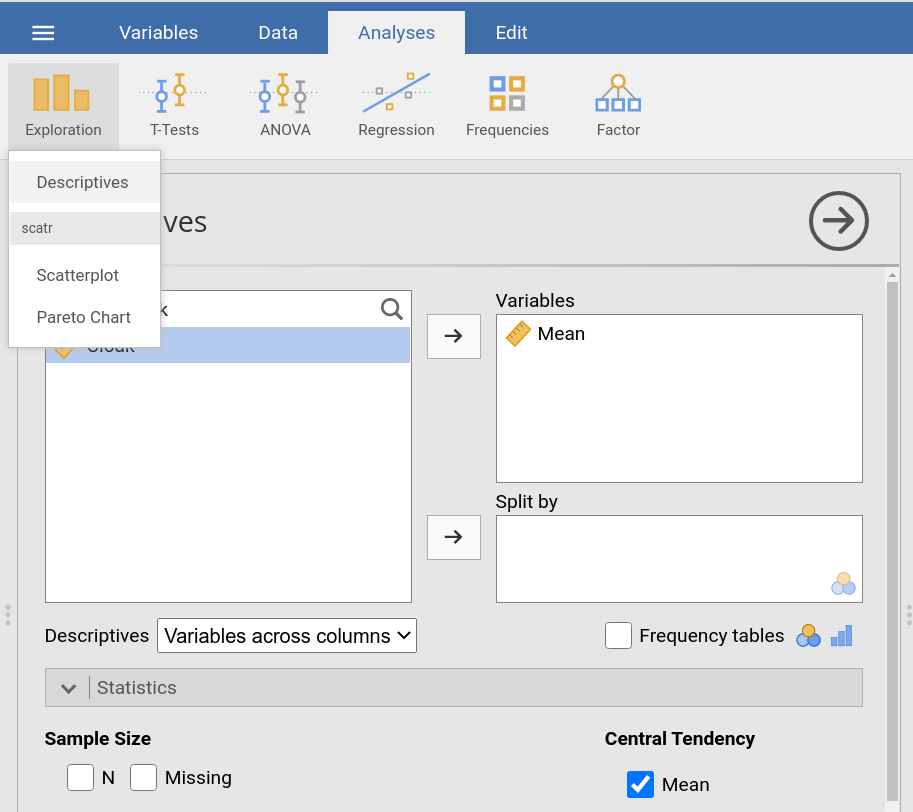
In jamovi this is done using: Analyzes → Exploration →
Descriptives. In the input panel, you assign the variable with the
individual mean Mean to Variables. |
 |
 |
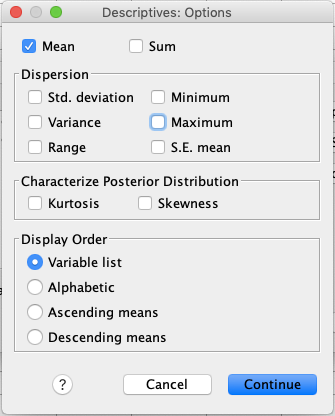
After clicking Options in the input window, one can adjust which
statistics one wishes to be calculated. For now, we just need to Mean and
could (in principle) just untick all other values. |
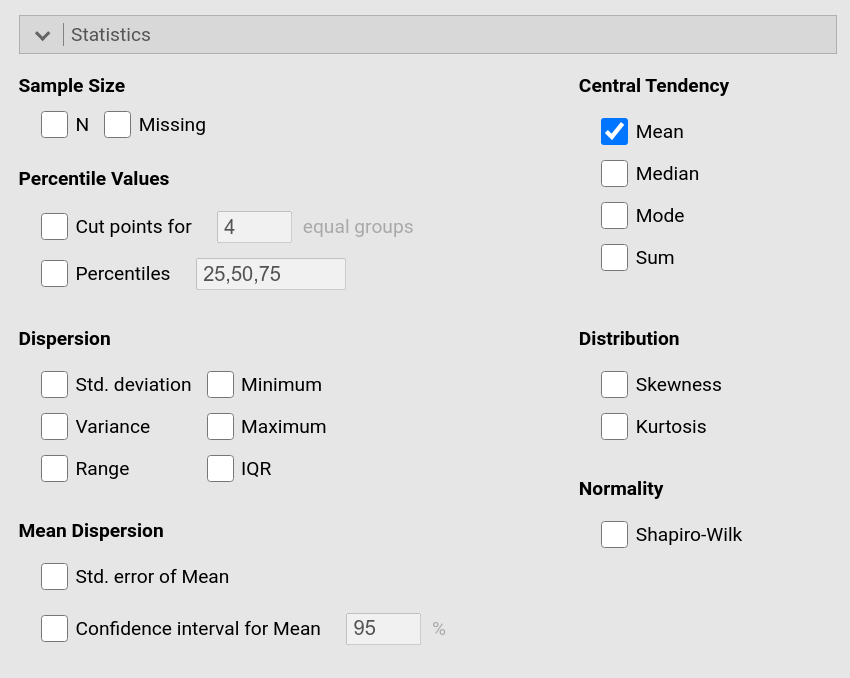
In jamovi, one can adjust which statistics one wishes to be calculated in the
drop-down-menu Statistics. There, we untick all settings except for
Mean. |
 |
 |
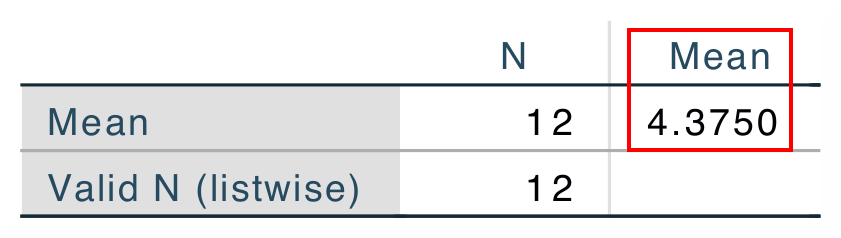
| The mean value (4.375) which is the output from the descriptive statistics is used in the next step. | |
 |
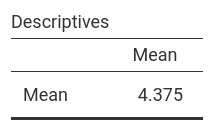 |
More specifically, it is used to calculate an adjustment variable that “corrects” the individual means for the group mean (i.e., it calculates for each
participant where the mean for that participant – Mean – is located relatively to the group mean – 4.375). |
|
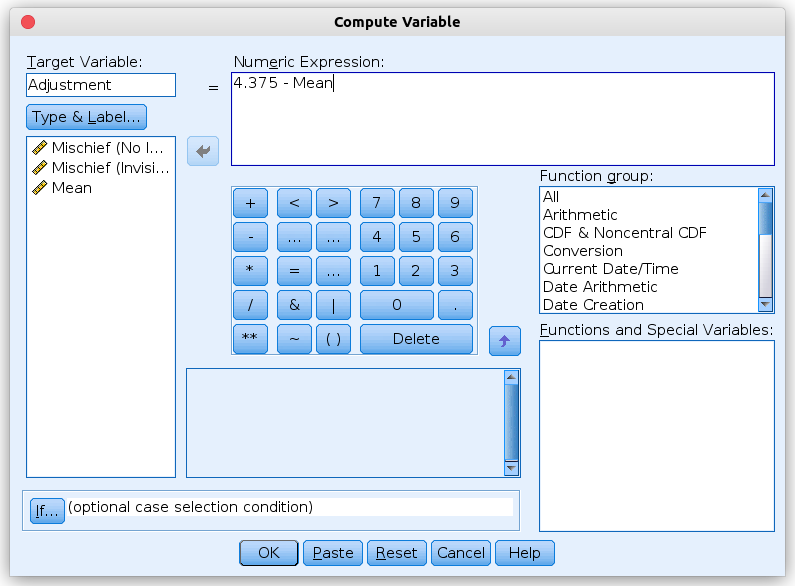
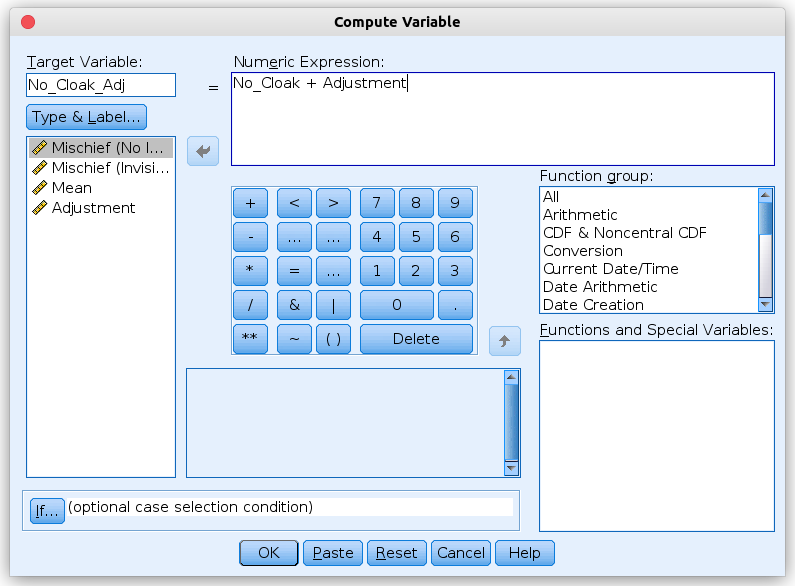
To calculate this Adjustment-variable in SPSS, we create a new variable
using: Transform → Compute Variable… In numeric expression, we
enter the term (4.375) - Mean as shown in the picture below in order to
calculate the new variable Adjustment. |
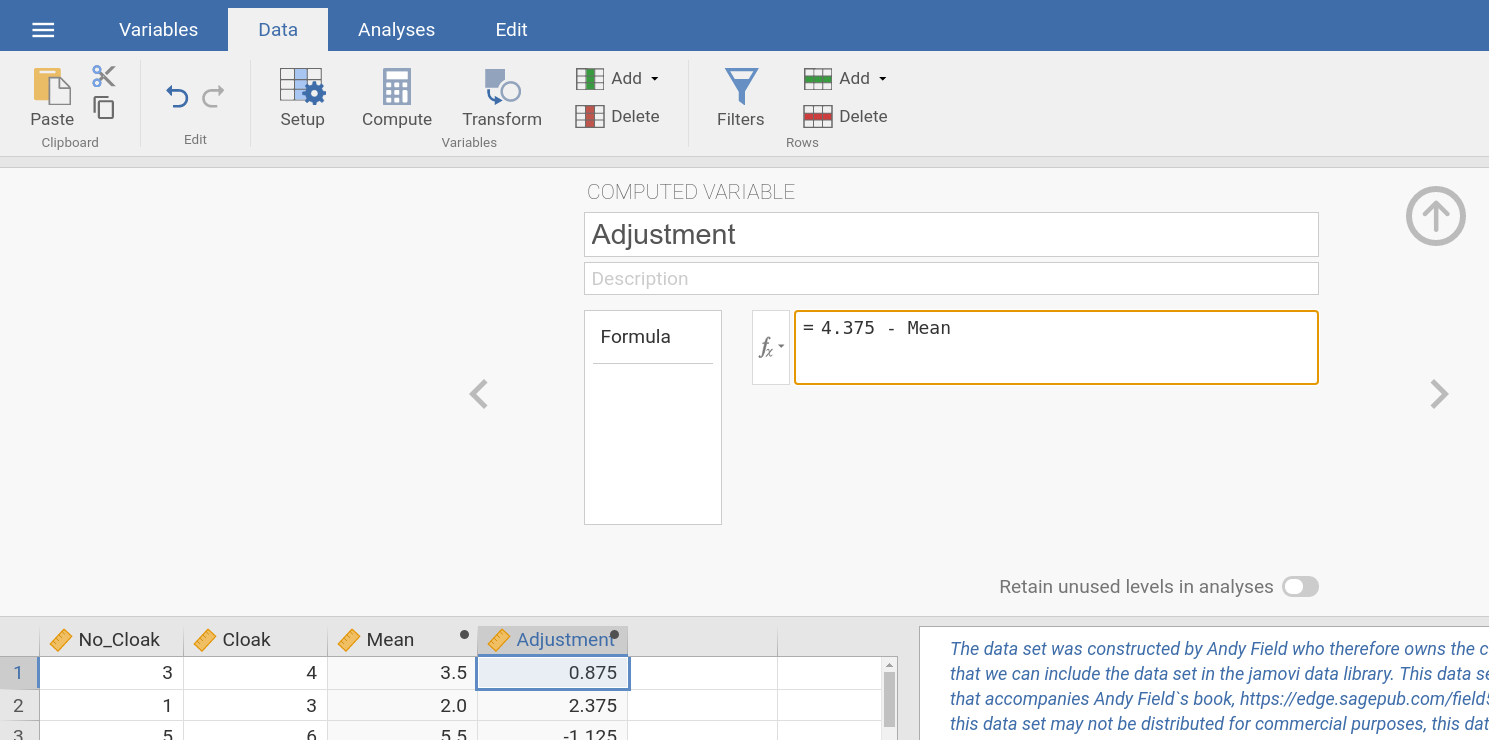
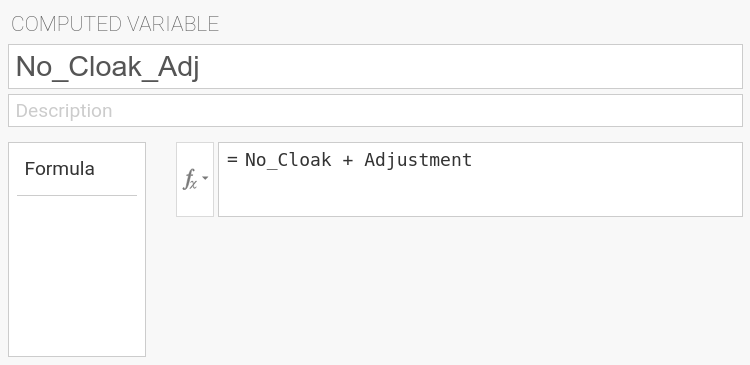
To calculate the Adjustment-variable in jamovi, we choose Data (tab)
→ Compute → Compute Variable, and enter the term (4.375) - Mean
into the input box (marked in red in the picture below) to calculate the new
variable Adjustment. |
 |
 |
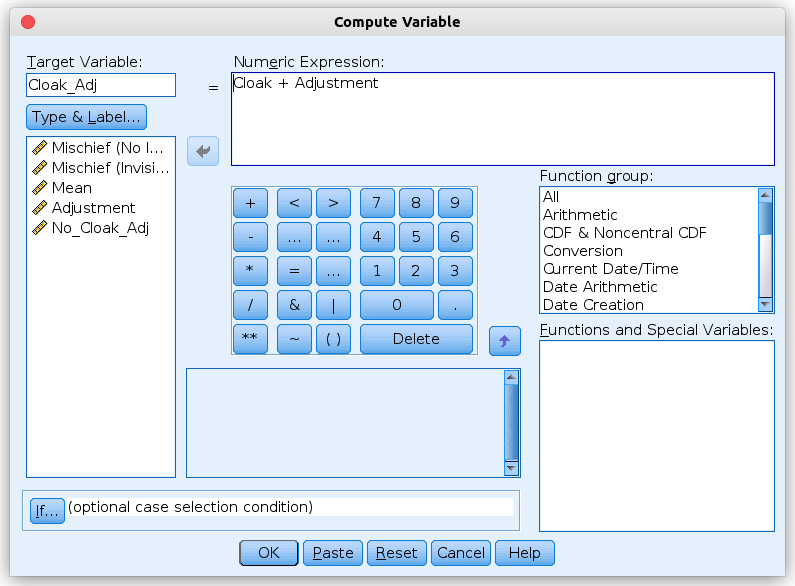
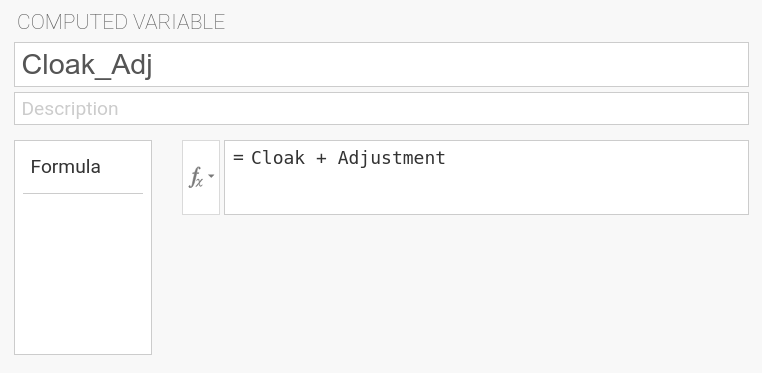
We create two further computed variables where we subtract that adjustment from each of the original variables, using the formula No_Cloak + Adjustment
to calculate No_Cloak_Adj, and the formula Cloak + Adjustment to calculate Cloak_Adj. |
|
 |
 |
 |
 |
In jamovi, one also could have calculated those two variables in a much
simpler way. For No_Cloak_Adj, the term to calculate is No_Cloak
- MEAN(No_Cloak, Cloak) + VMEAN(MEAN(No_Cloak, Cloak)) and for
Cloak_Adj the term is Cloak - MEAN(No_Cloak, Cloak)
+ VMEAN(MEAN(No_Cloak, Cloak)).
VMEAN means vertical mean, i.e., it calculates the mean over a column / a
variable, in our case over the individual means of the two conditions
(No_Cloak and Cloak). |
|
| For these two variables and the two original (unadjusted) variables, we now calculate descriptives statistics. We do this using the same procedure for calculating descriptive statistics as shown above. | |
In SPSS this is done with: Analyze → Descriptive Statistics →
Descriptives. In the input window, you assign the variables No_Cloak,
Cloak, No_Cloak_Adj, and Cloak_Adj to Variable(s). We click
Options in the input window and ensure that Mean and S.E. Mean
are ticked. |
In jamovi this is done using: Analyzes → Exploration → Descriptives. In the
input panel, you assign variables No_Cloak, Cloak, No_Cloak_Adj,
and Cloak_Adj to Variables. Afterwards, we open the drop-down-menu
Statistics. There, we untick all statistics except for Mean and
Std. error of mean. |
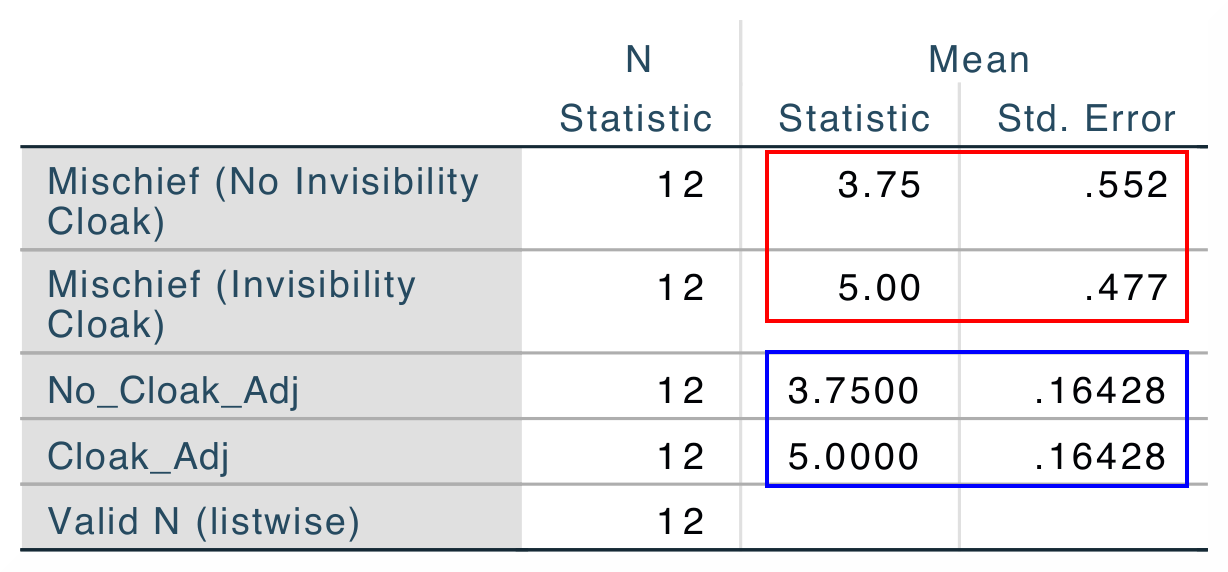
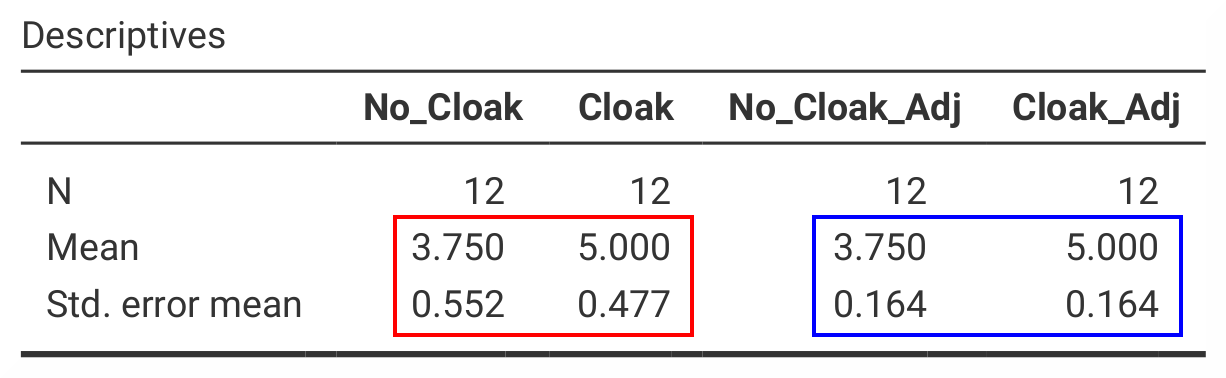
The output from either program, SPSS and jamovi, the output shows that the means for No_Cloak is the same as the mean for No_Cloak_Adj while the
standard error of the mean was reduced to about one third. The same is true for the comparison of Cloak and Cloak_Adj. This indicates that we – by
using a repeated-measures-design – could reduce our error when estimating the mean quite substantially. |
|
 |
 |
| You can download the SPSS output files and the jamovi files with the analyses demonstrated above underneath. | |
| SPSS data file containing the computed variables SPSS output file containing the analyses | jamovi file with the analyses |