この節の作者: Rebecca Vederhus, Sebastian Jentschke
From SPSS to jamovi: Analysis of Covariance (ANCOVA)
This comparison shows how a regression with one predictor and two dummy variables is performed in SPSS and jamovi. The SPSS test follows the description in chapter 13.3 of Field (2017), especially Output 13.1 - 13.2. It uses the data set Puppy Love Dummy.sav which can be downloaded from the web page accompanying the book.
| SPSS | jamovi |
|---|---|
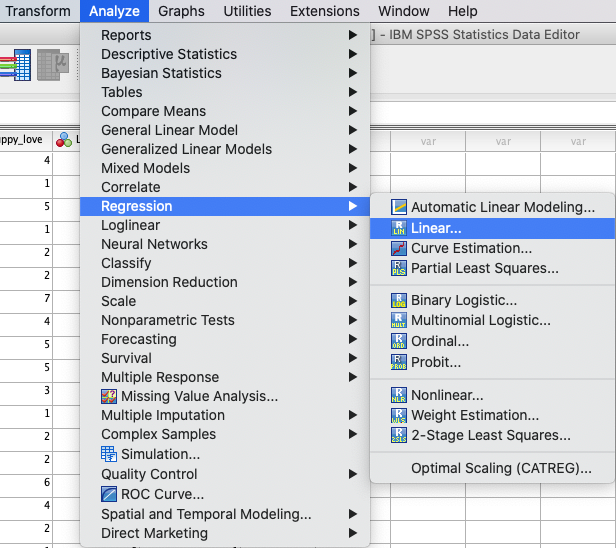
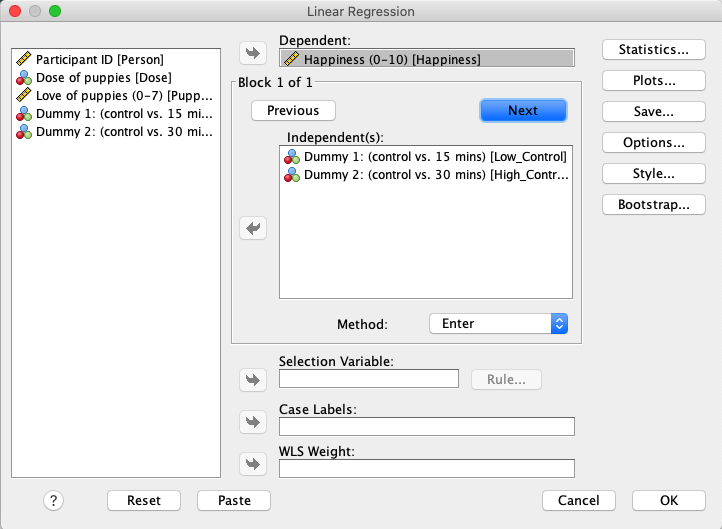
In SPSS you can run a regression using: Analyze → Regression →
→ Linear. |
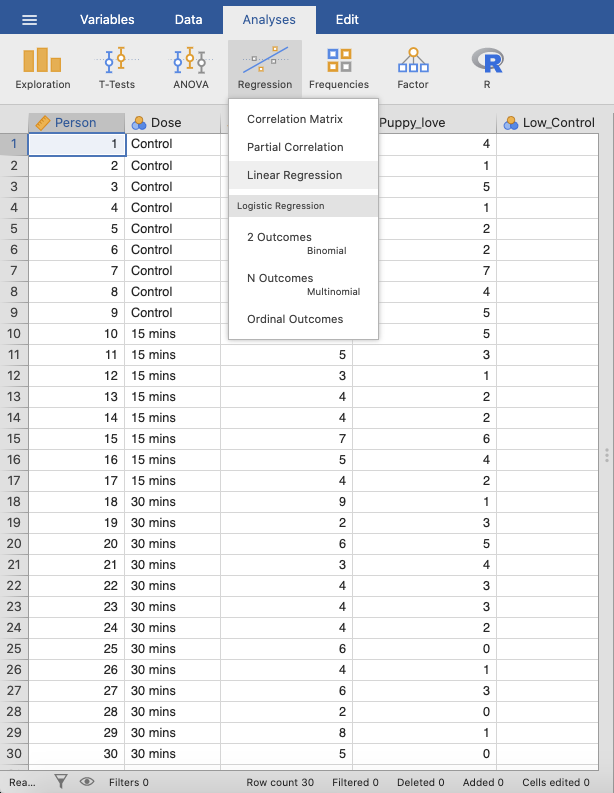
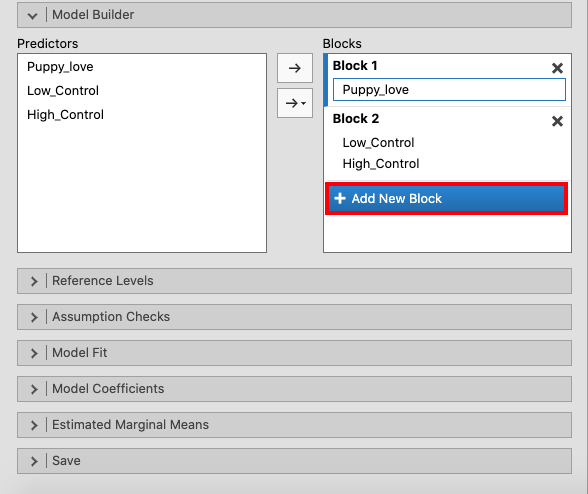
In jamovi you do this using: Analyses → Regression → Linear
Regression. |
 |
 |
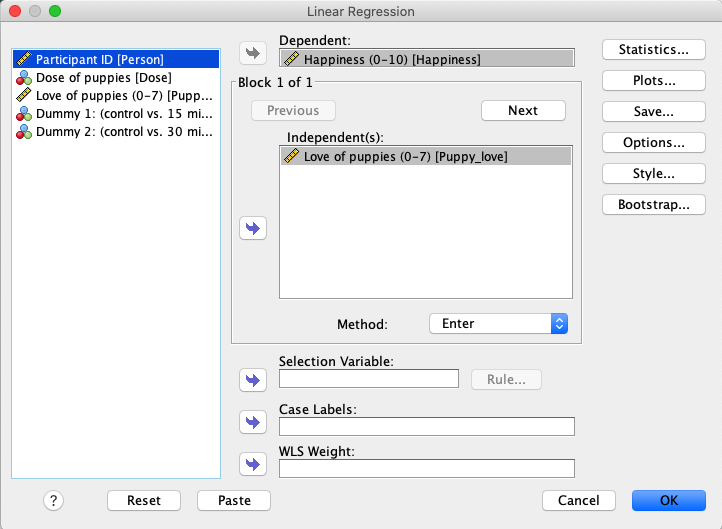
In SPSS, move Happiness to the variable box Dependent and
Puppy_love to the variable box Independent(s). |
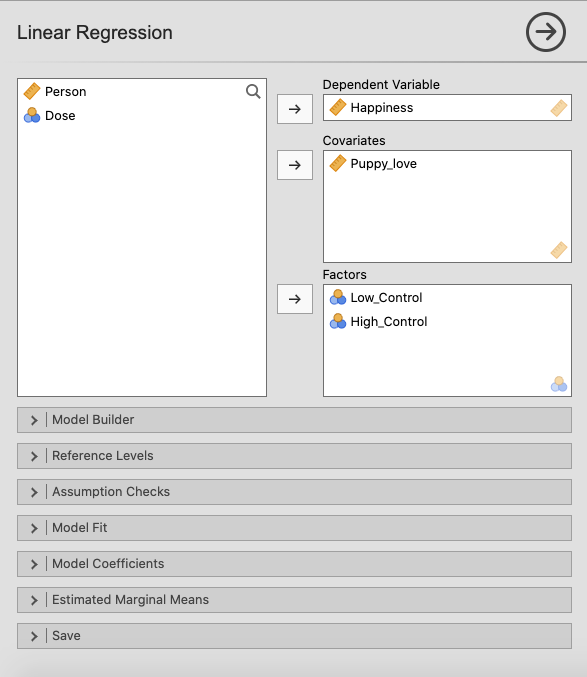
In jamovi, move Happiness to the variable box Dependent Variable,
Puppy_love to the variable box Covariates, and Low_Control and
High_Control to the Factors box. |
 |
 |
Press the Next button to create a new block of Independent(s), and
move the variables Low_Control and High_Control into this box. |
Create a new block of independent variables using Model Builder. Press
+ Add New Block and move Low_Control and High_Control into
Block 2. |
 |
 |
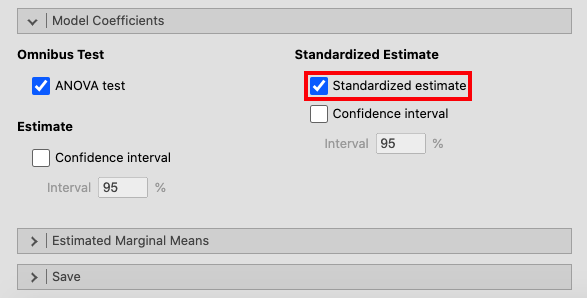
Open the Model Coefficients window and tick the box for Standardized
estimate. |
|
 |
|
| If you compare the SPSS and jamovi outputs, the results are the same. However, the output from jamovi is much clearer as it only includes the most important information. The results are found in slightly different places in SPSS and in jamovi. | |
|
|
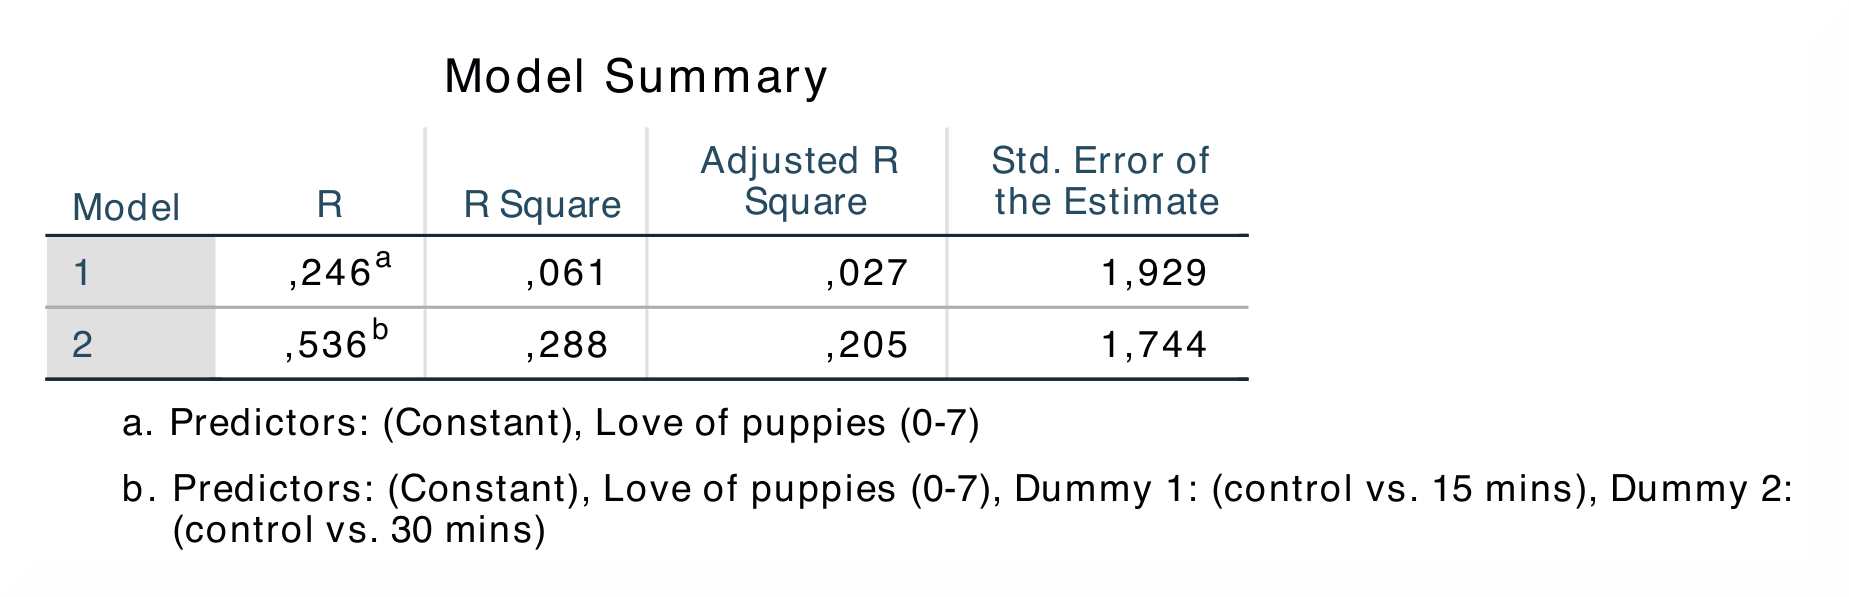
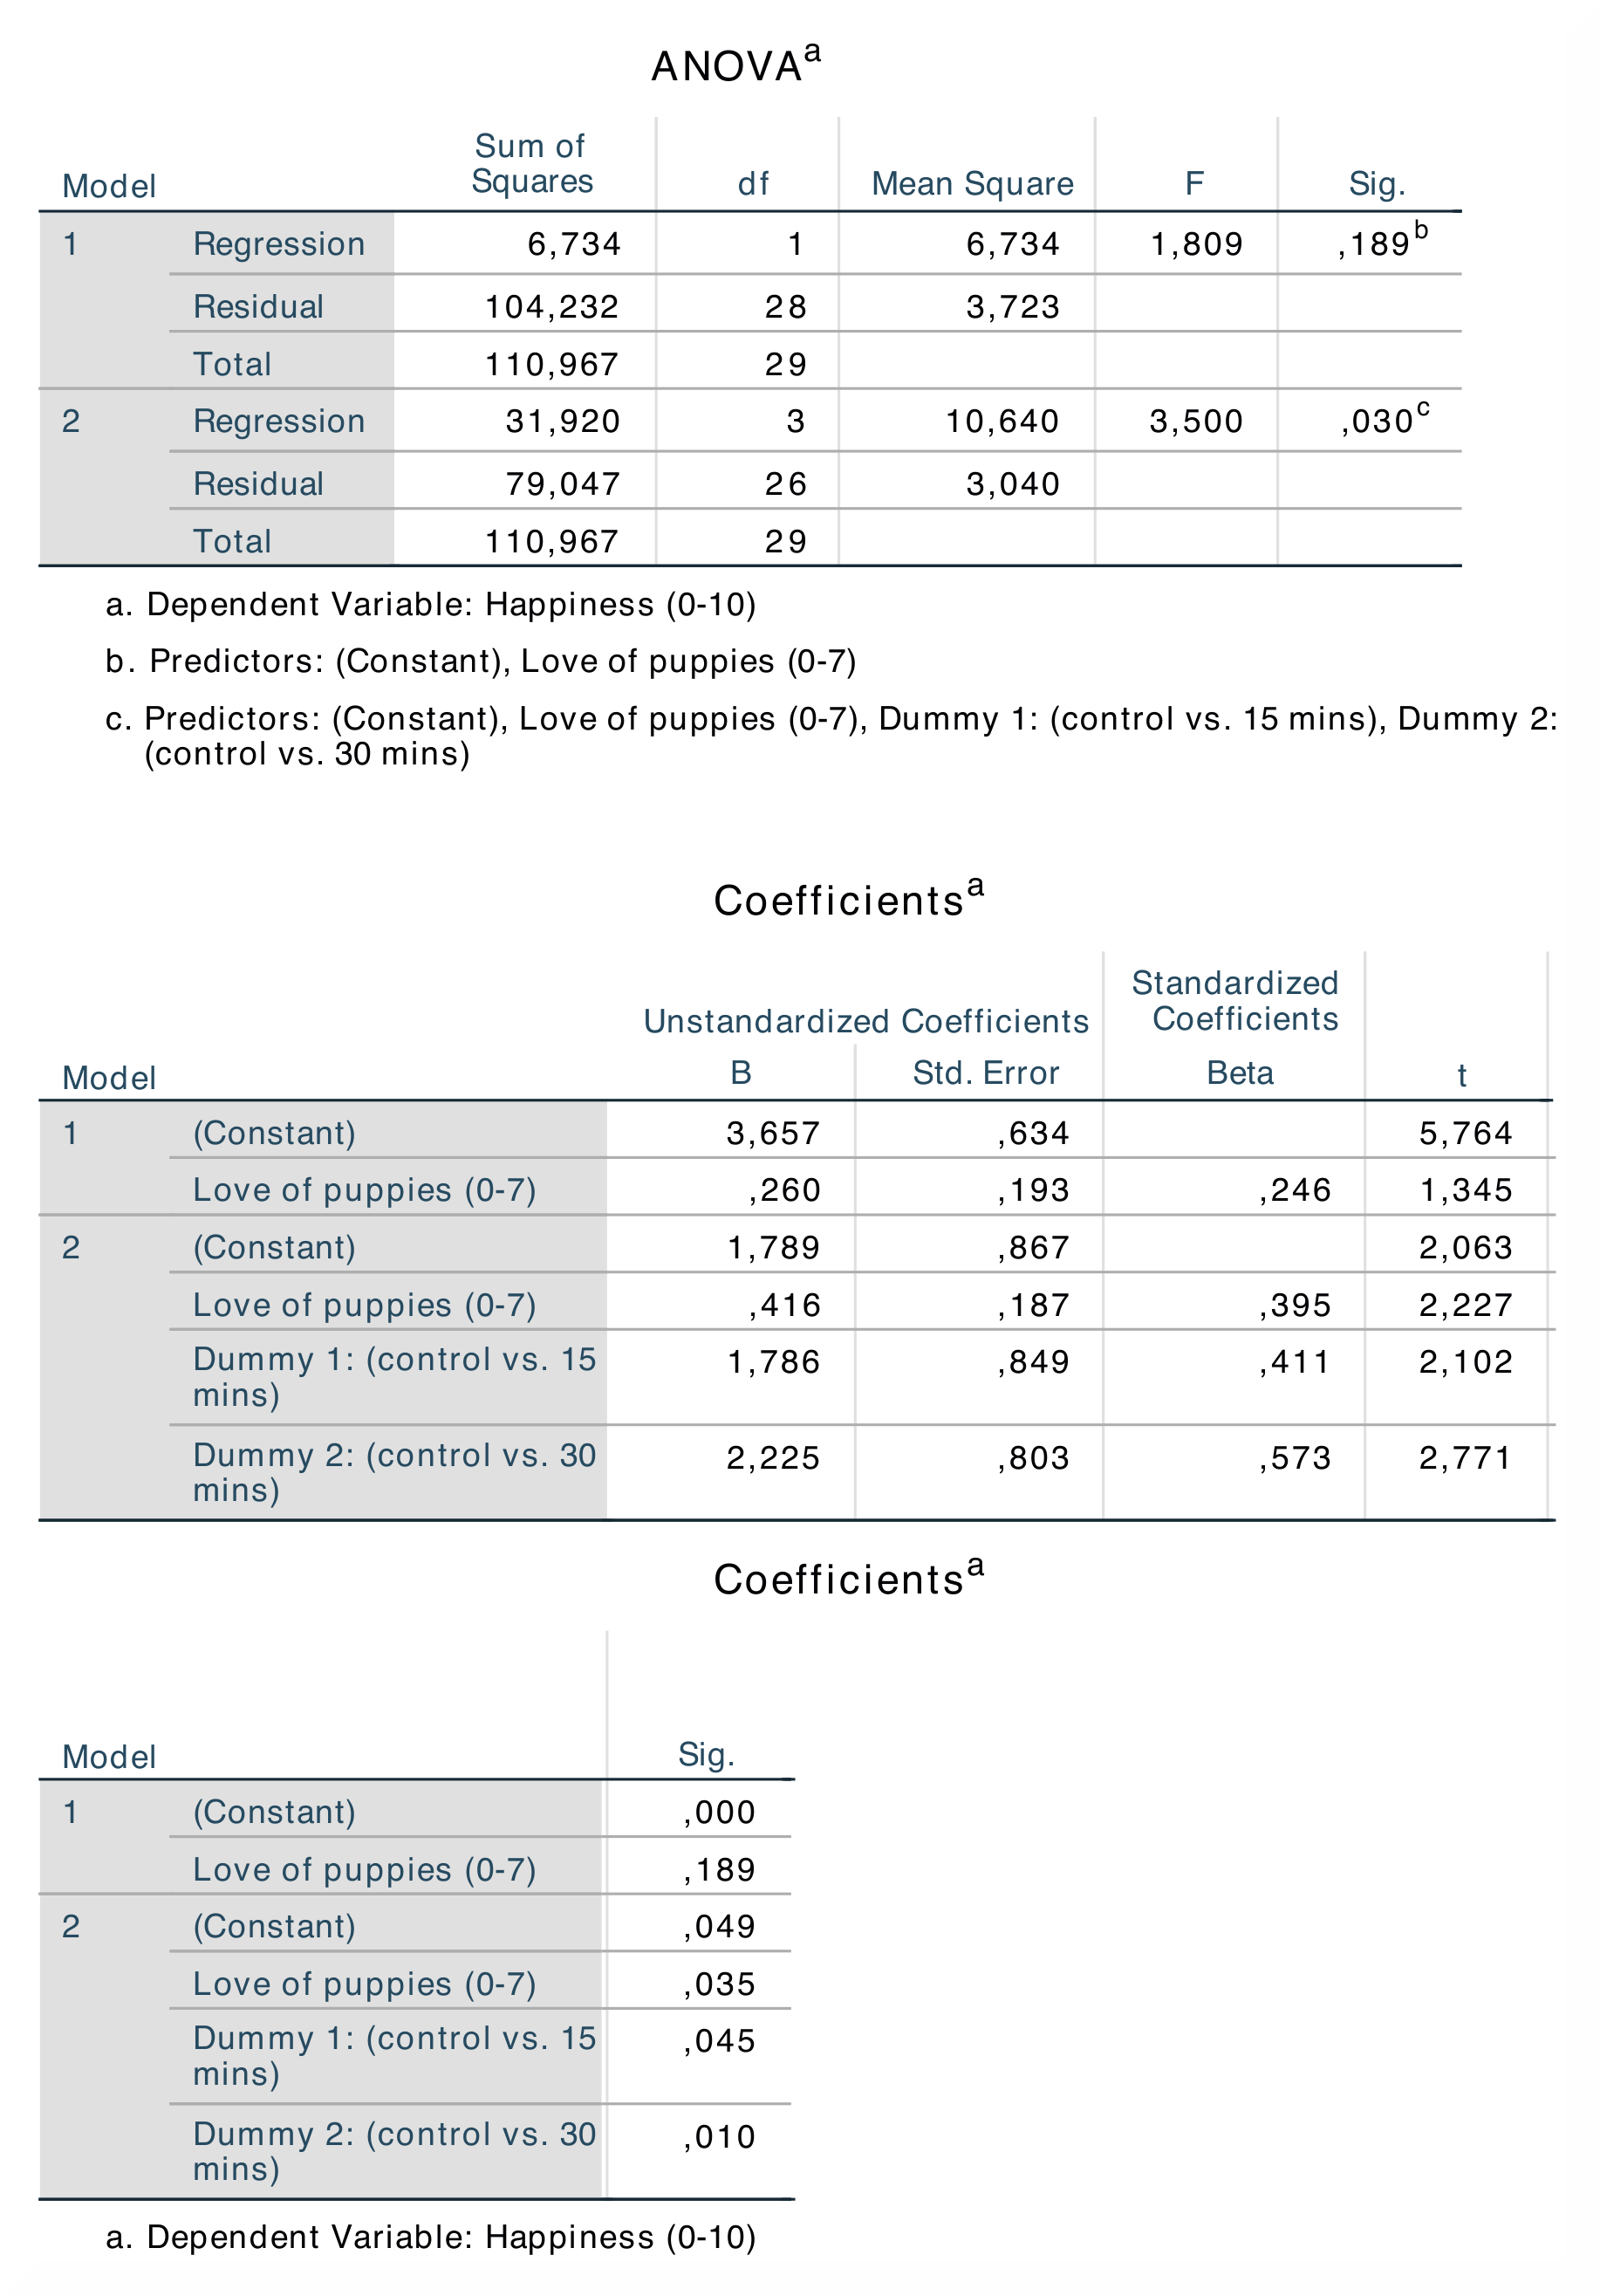
In SPSS, the output table Model Summary starts with R and R². The
R²-value for model 1 shows the goodness of fit when only the covariate is
included in the analysis, and the value for model 2 shows the results when
the dummy variables and the covariate are included. The ANOVA table
presents the sum of squares for the regression, which tells us how many units
of variance the model accounts for. The most interesting table is the
Coefficients table, where you can find the differences in b-*values and
*β-values for the two models, as well as their significance values. |
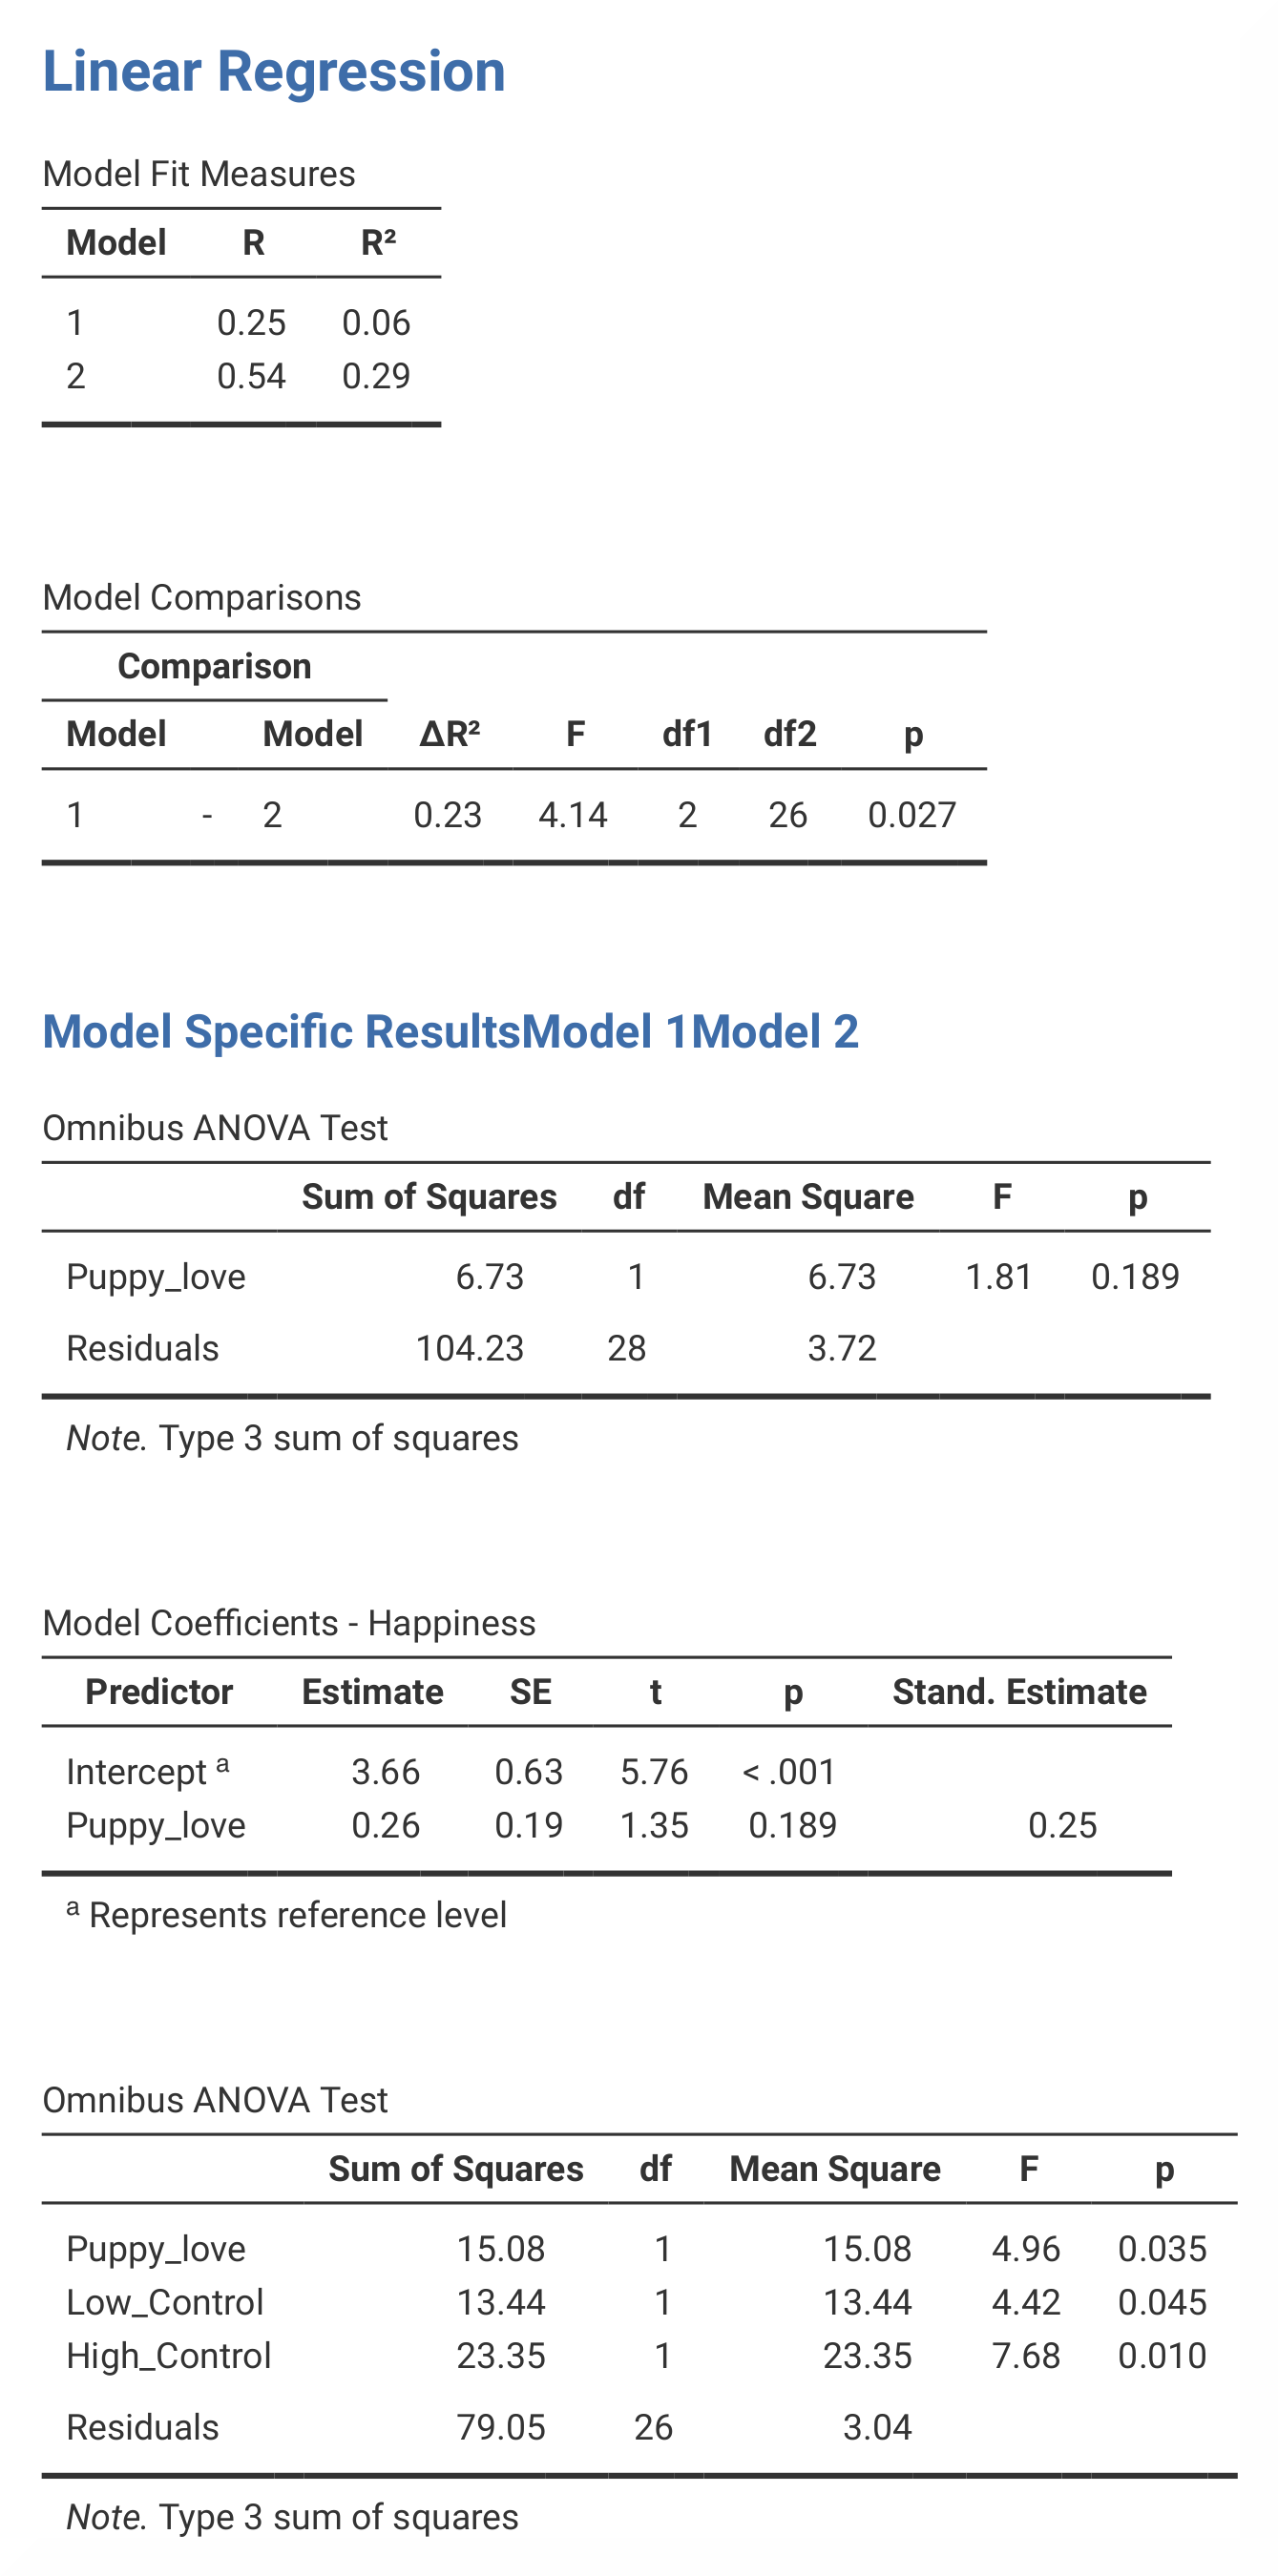
In jamovi, the R *and *R²-values are found in the output table Model Fit
Measures. The Sum of Squares and F-values are found in the Omnibus
ANOVA Test table, which in jamovi is separated into a table for model 1 and
a table for model 2. Nonetheless, the numbers appear in the same place in the
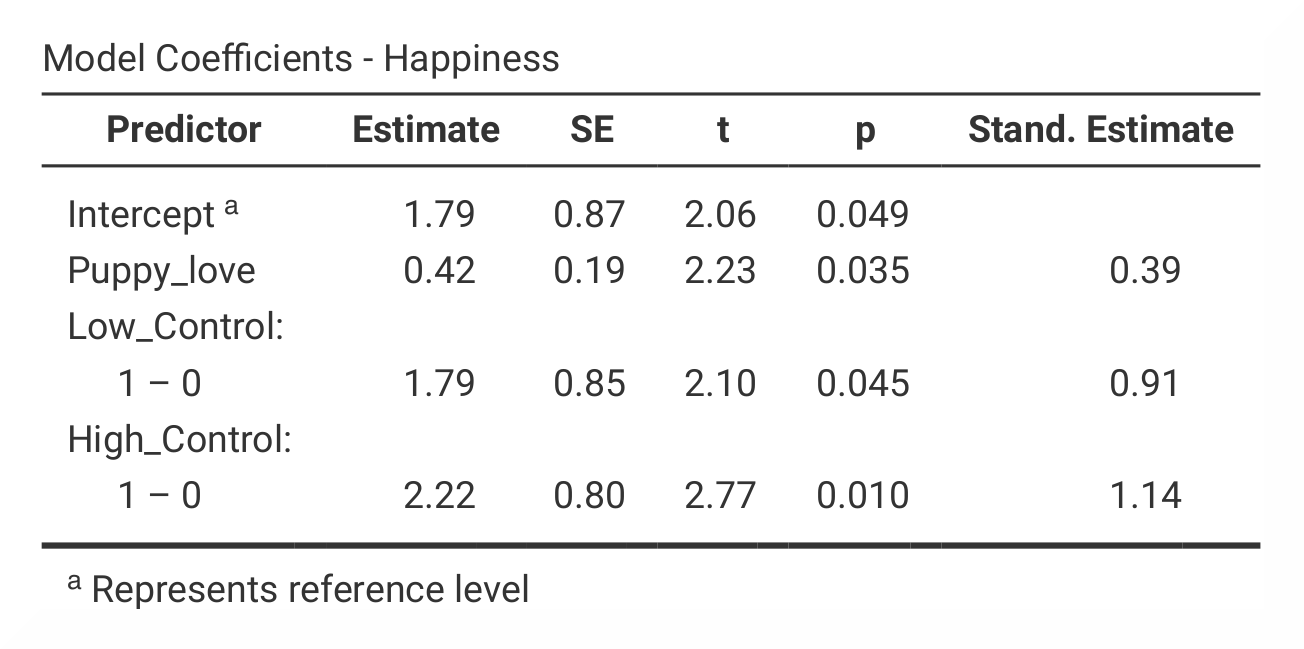
tables. The Coefficients table is also divided into two tables - one for
each model – in jamovi. Here the b-values are found under Estimate and the
the β-values under Stand. Estimate. |
The R *and *R²-values are found in the first and second column in the first output table in both SPSS and jamovi. In contrast to SPSS, jamovi splits the
The numerical values for the model 2 statistics are identical: R = 0.54, R² = 0.29; b = 0.42, p < .05; β = 0.39, p < .05. |
|
| If you wish to replicate those analyses using syntax, you can use the commands below (in jamovi, just copy to code below to Rj). Alternatively, you can download the SPSS output files and the jamovi files with the analyses from below the syntax. | |
REGRESSION
  /MISSING LISTWISE
  /STATISTICS COEFF OUTS R ANOVA
  /CRITERIA=PIN(.05) POUT(.10)
  /NOORIGIN
  /DEPENDENT Happiness
  /METHOD=ENTER Puppy_love
  /METHOD=ENTER Low_Control High_Control.
|
jmv::linReg(
    data = data,
    dep = Happiness,
    covs = Puppy_love,
    factors = vars(Low_Control, High_Control),
    blocks = list(
        list("Puppy_love"),
        list("Low_Control", "High_Control")),
    refLevels = list(
        list(var="Low_Control", ref="0"),
         list(var="High_Control", ref="0")),
    anova = TRUE)
|
| SPSS output file containing the analyses | jamovi file containing the analyses |
References
Field, A. (2017). Discovering statistics using IBM SPSS statistics (5th ed.). SAGE Publications. https://edge.sagepub.com/field5e