この節の作者: Rebecca Vederhus, Sebastian Jentschke
From SPSS to jamovi: Analysis of frequencies
This comparison shows how a Chi-square test is conducted in SPSS and jamovi. The SPSS test follows the description in chapters 19.7.2-19.7.3 in Field (2017), especially figures 19.4-19.5 and output 19.2-19.4. It uses the data set Cats Weight.sav which can be downloaded from the web page accompanying the book.
| SPSS | jamovi |
|---|---|
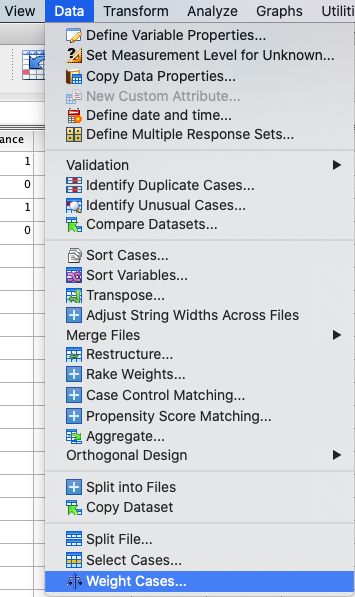
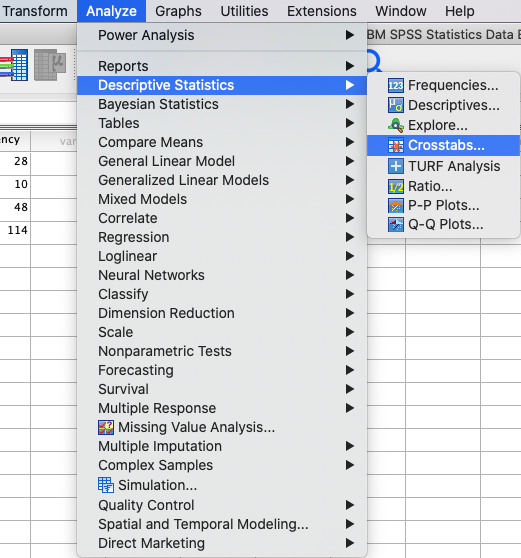
In SPSS, you run a chi-square test using : Analyze → Descriptive
Statistics → Crosstabs. Before this, you can weight cases by following
these steps: Data → Weight Cases. |
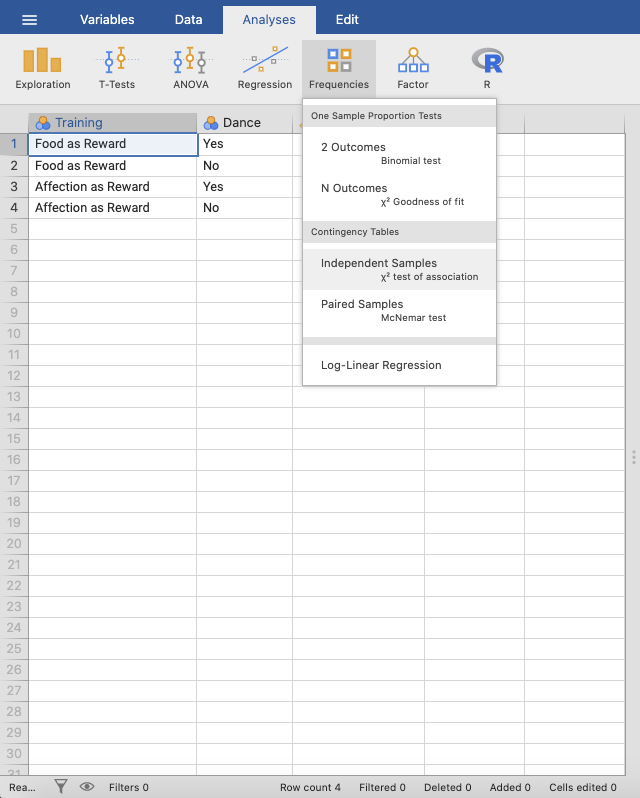
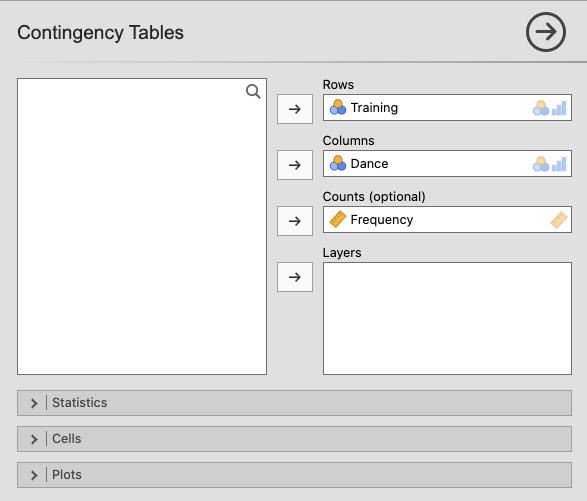
In jamovi, this can be done using: Analyses → Frequencies →
Independent Samples – χ² test of association. |
 |
 |
 |
|
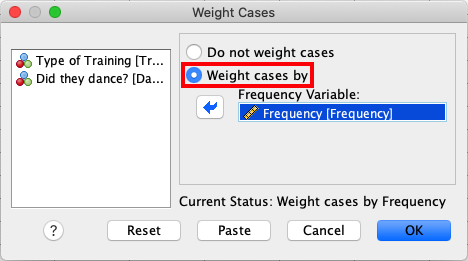
In the Weight Cases window, click Weight cases by and move
Frequency to the box called Frequency Variable. |
In jamovi, move Training to Rows, Dance to Columns, and
Frequency to Counts (optional). |
 |
 |
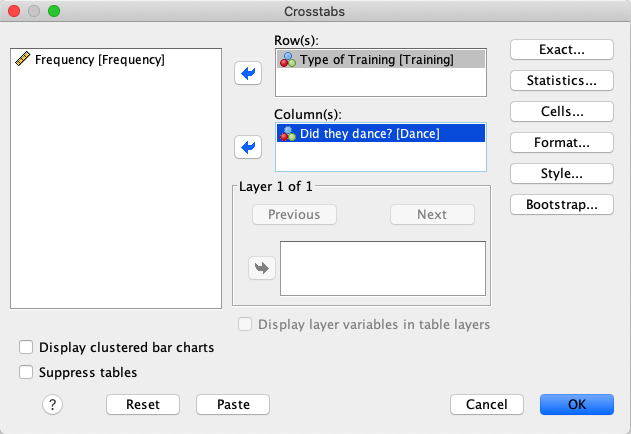
In SPSS, move the Training variable to the Row(s) box and the
Dance variable to the variable box Column(s). |
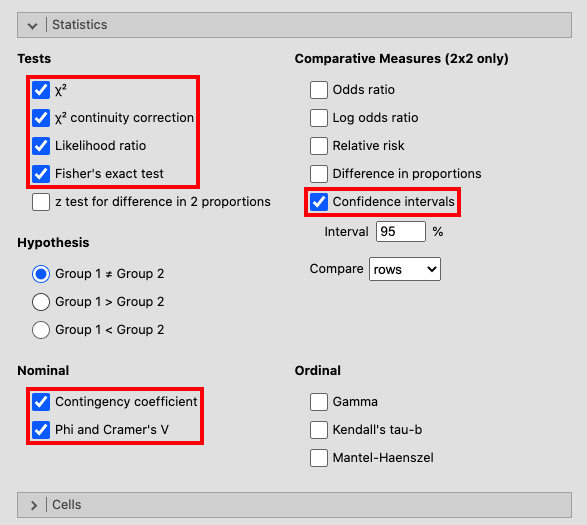
Open the Statistics window and tick the boxes for: χ², continuity
correction, Likelihood ratio, Fisher’s exact test, Confidence
intervals, Contingency coefficient and Phi and Cramer’s V. |
 |
 |
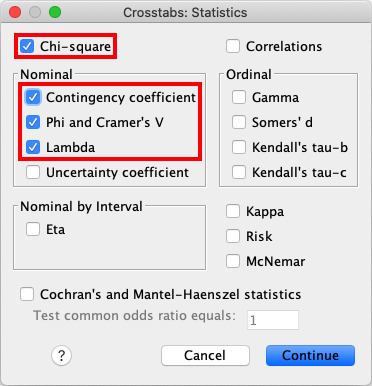
Open the Statistics window and check the boxes for Chi-square,
Contingency coefficient, Phi and Cramer’s V and Lambda. |
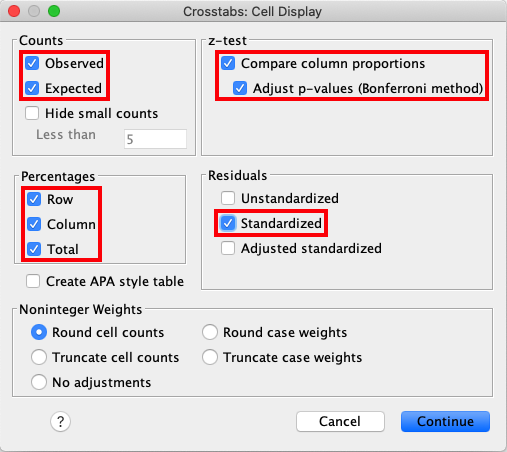
In the window for Cells, tick all the boxes. |
 |
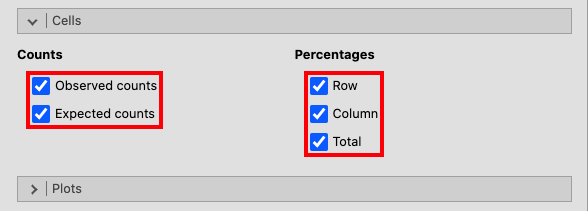 |
Access Cells from the main menu, and tick the boxes as shown in the
picture below. |
|
 |
|
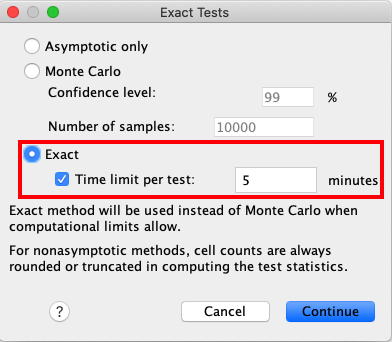
Lastly, open the window for Exact and click Exact and Time limit
per test: 5 minutes. |
|
 |
|
| When comparing the output from SPSS and jamovi, the results are exactly the same, although in jamovi they are much clearer and therefore easier to interpret. | |
 |
 |
 |
|
 |
|
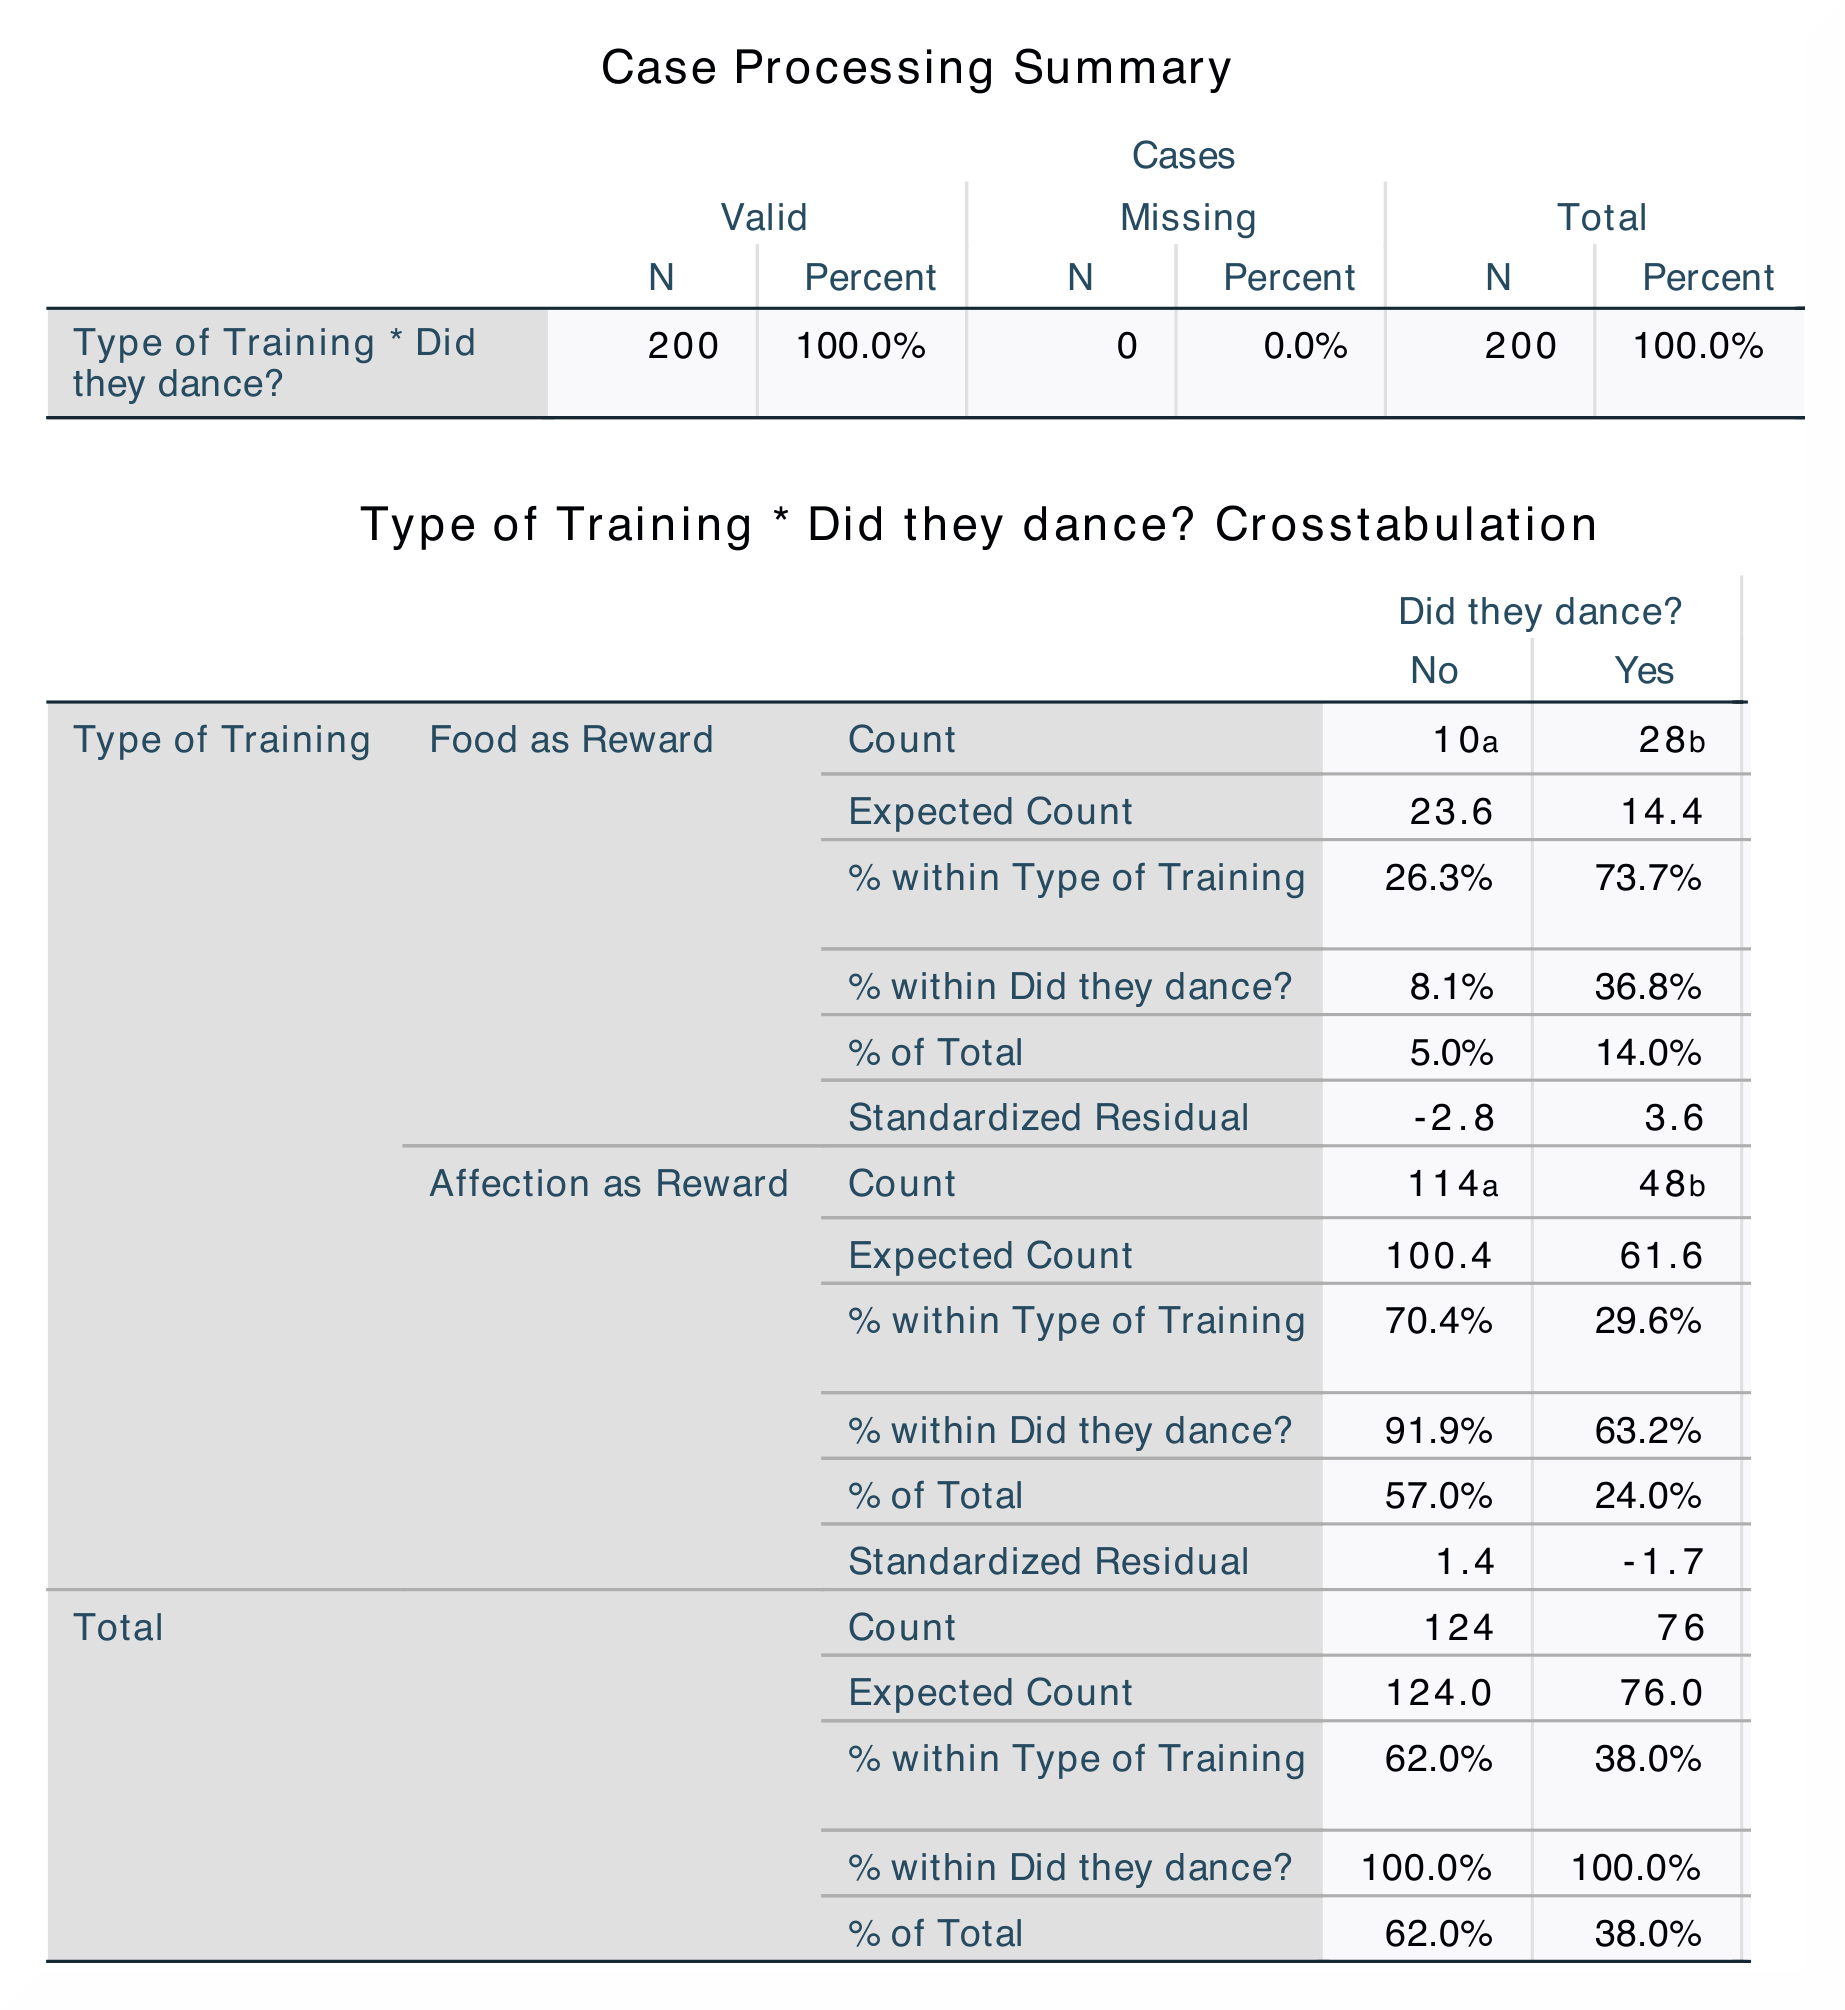
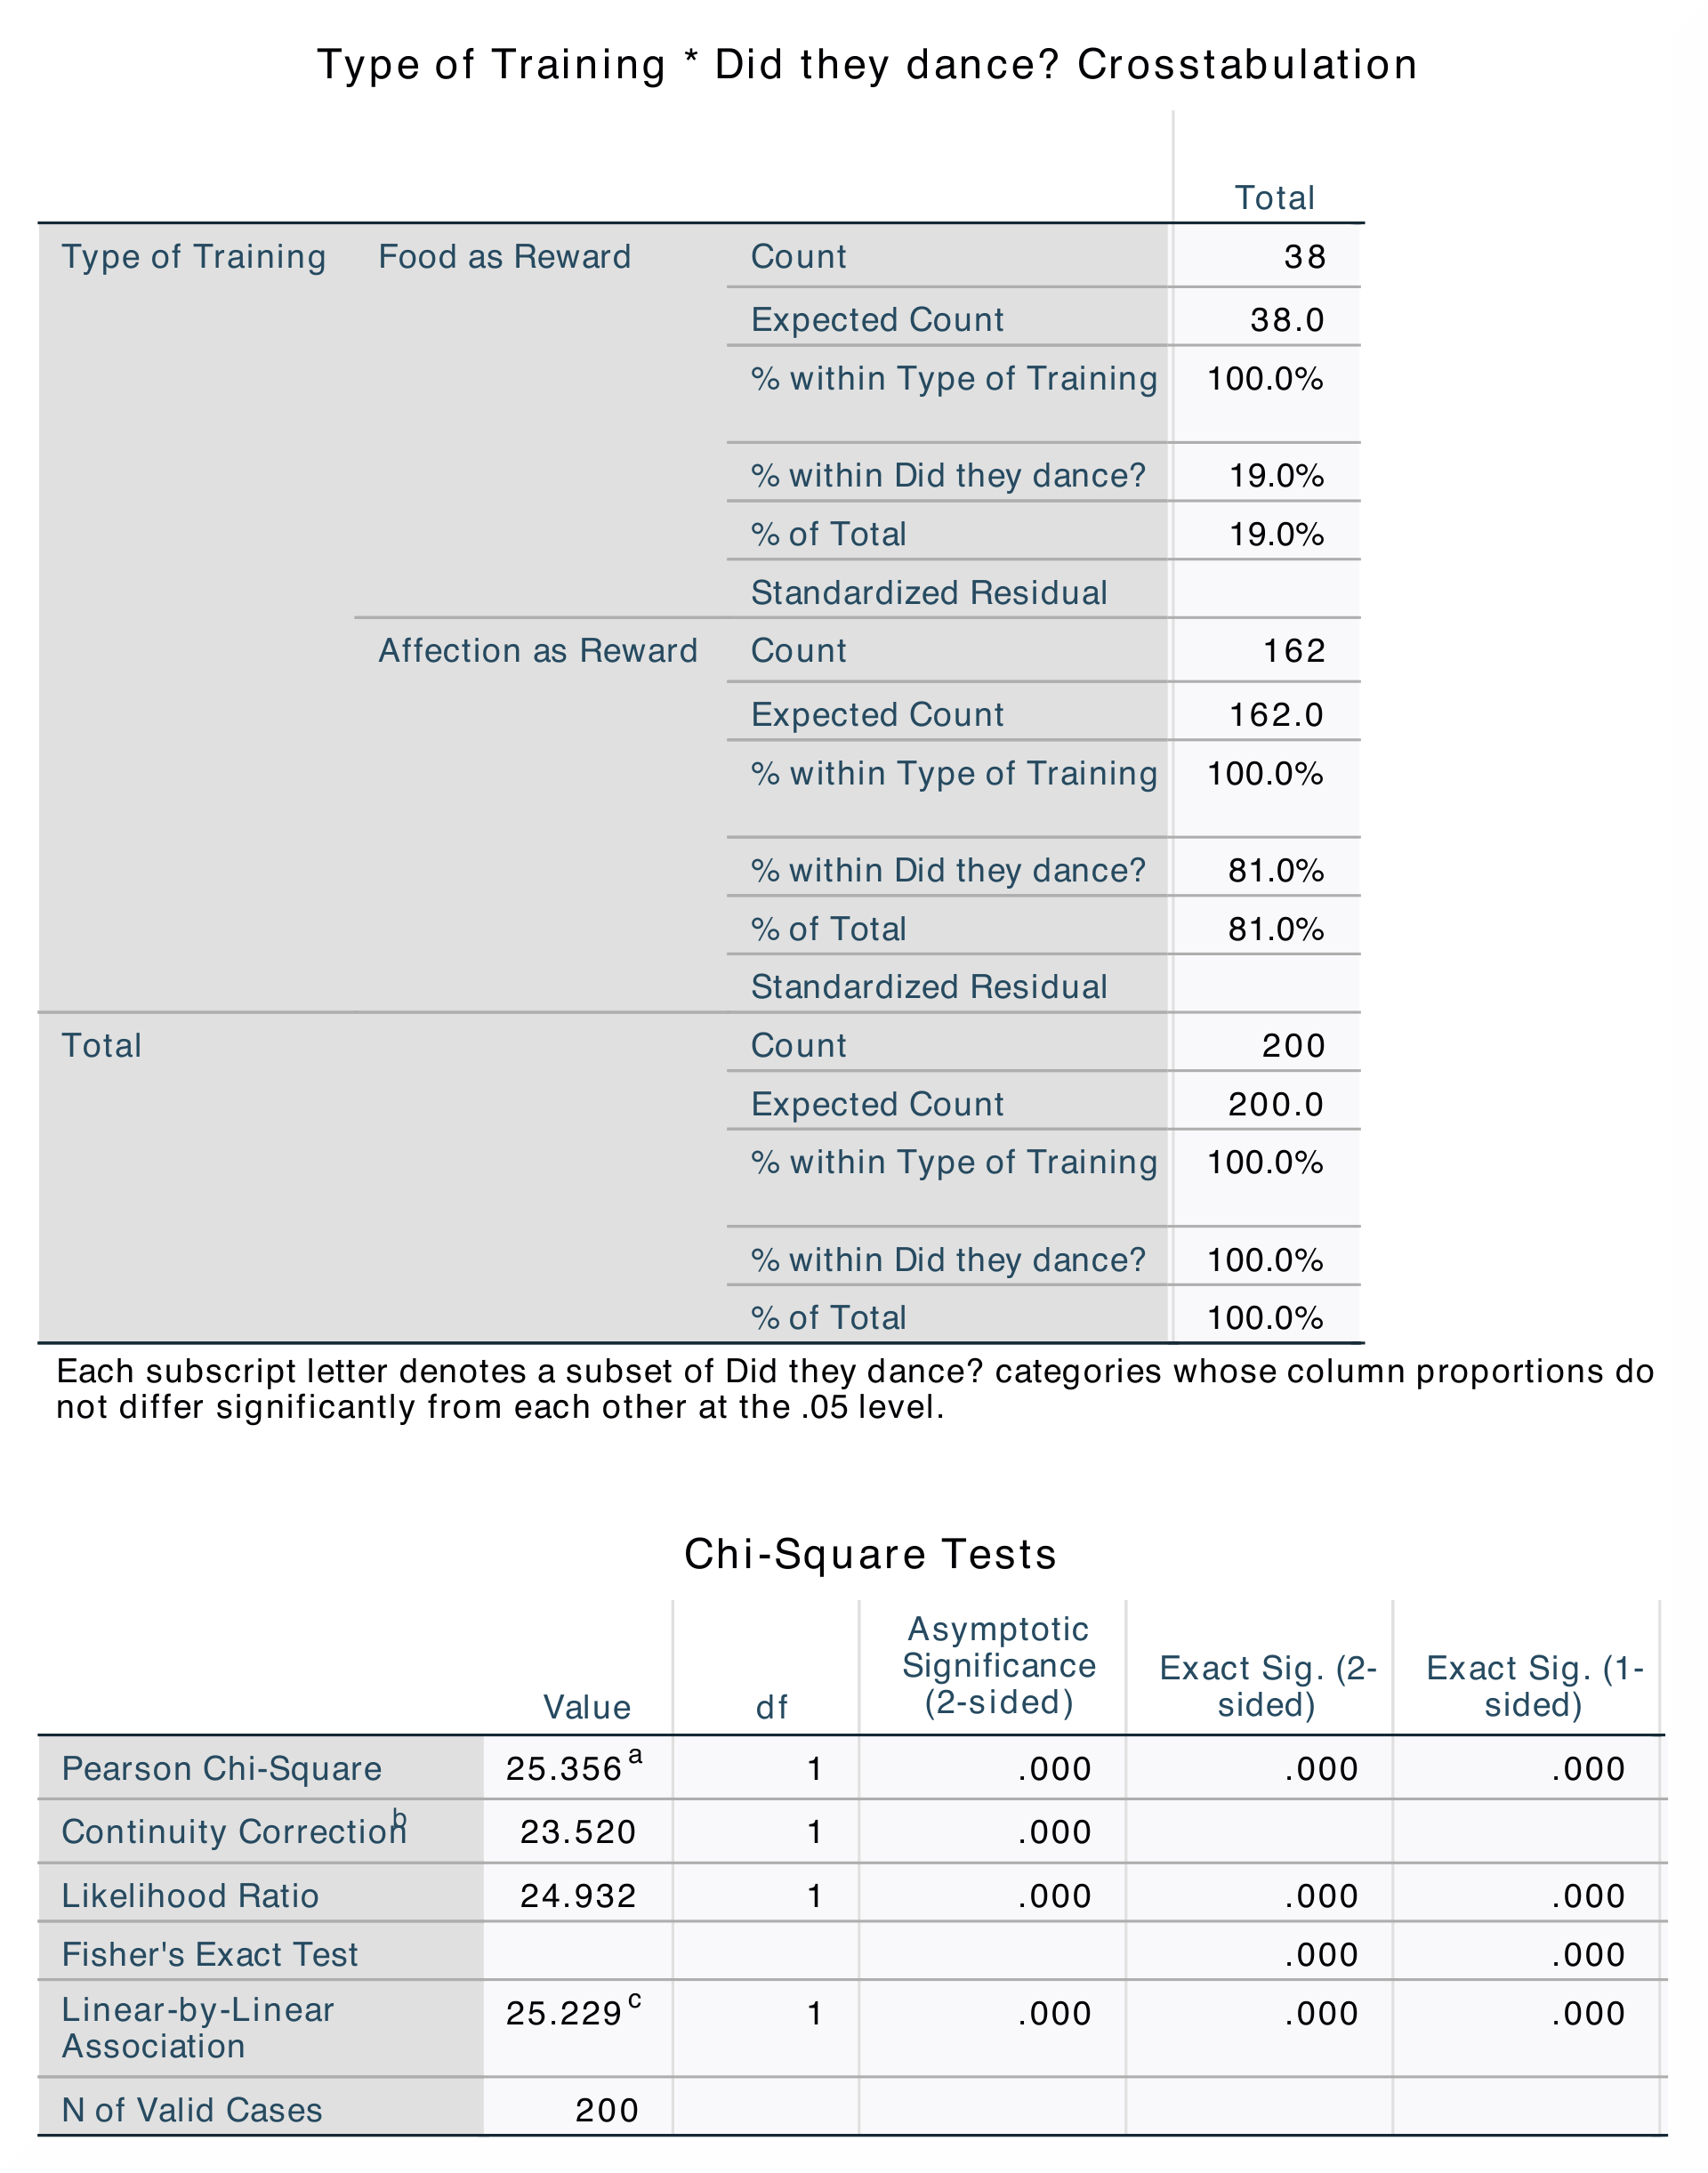
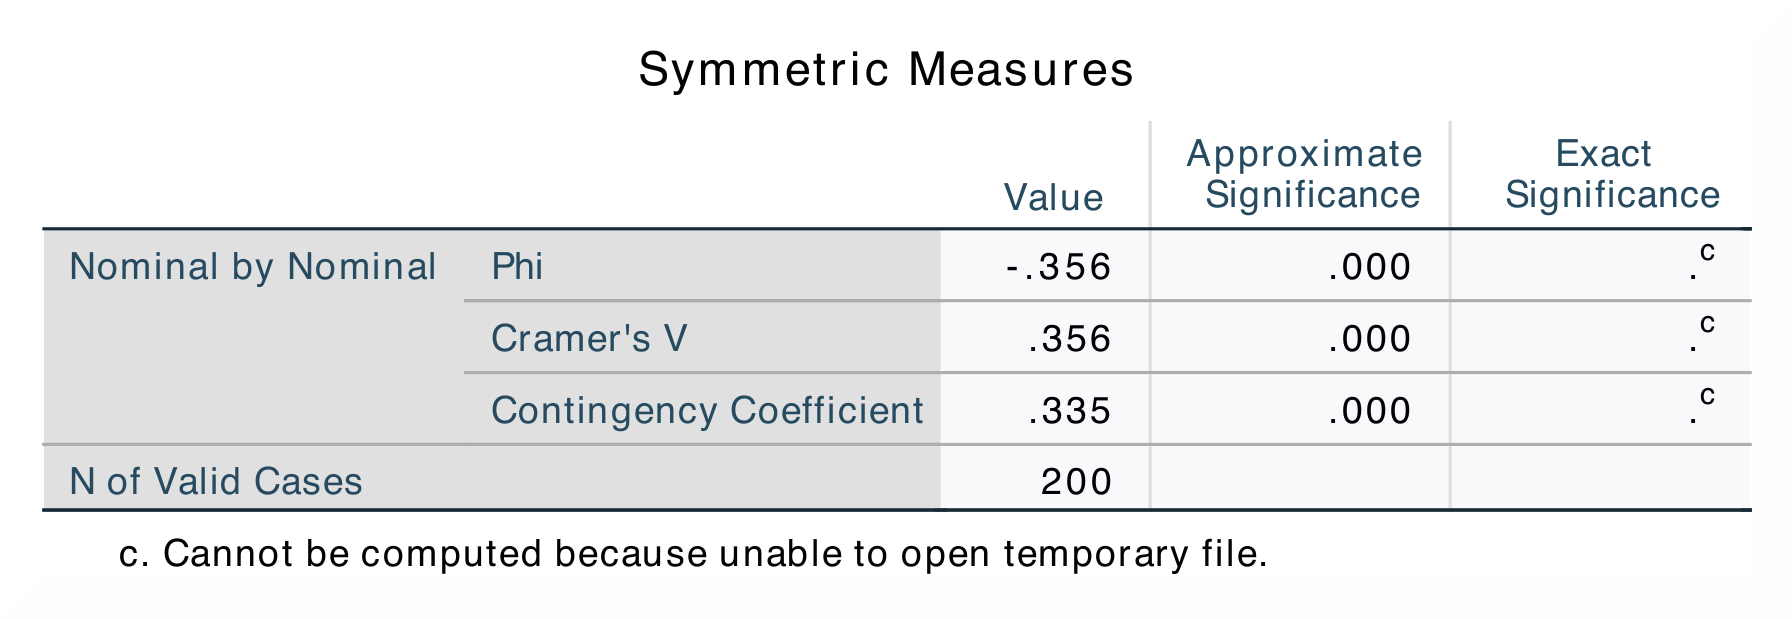
In SPSS, the Crosstabulation table shows the amount of cases that can be
categorized into each combination. We can see the amount of cats that danced,
and how many of these were rewarded with food or affection. In the
Chi-Square Tests table, you can find the statistic of the chi-square and
the significance level of this value. Degrees of freedom are also presented
in this table. The measures of association is presented in the Symmetric
Measures table. By looking at these values, you can find an estimate of the
effect size. |
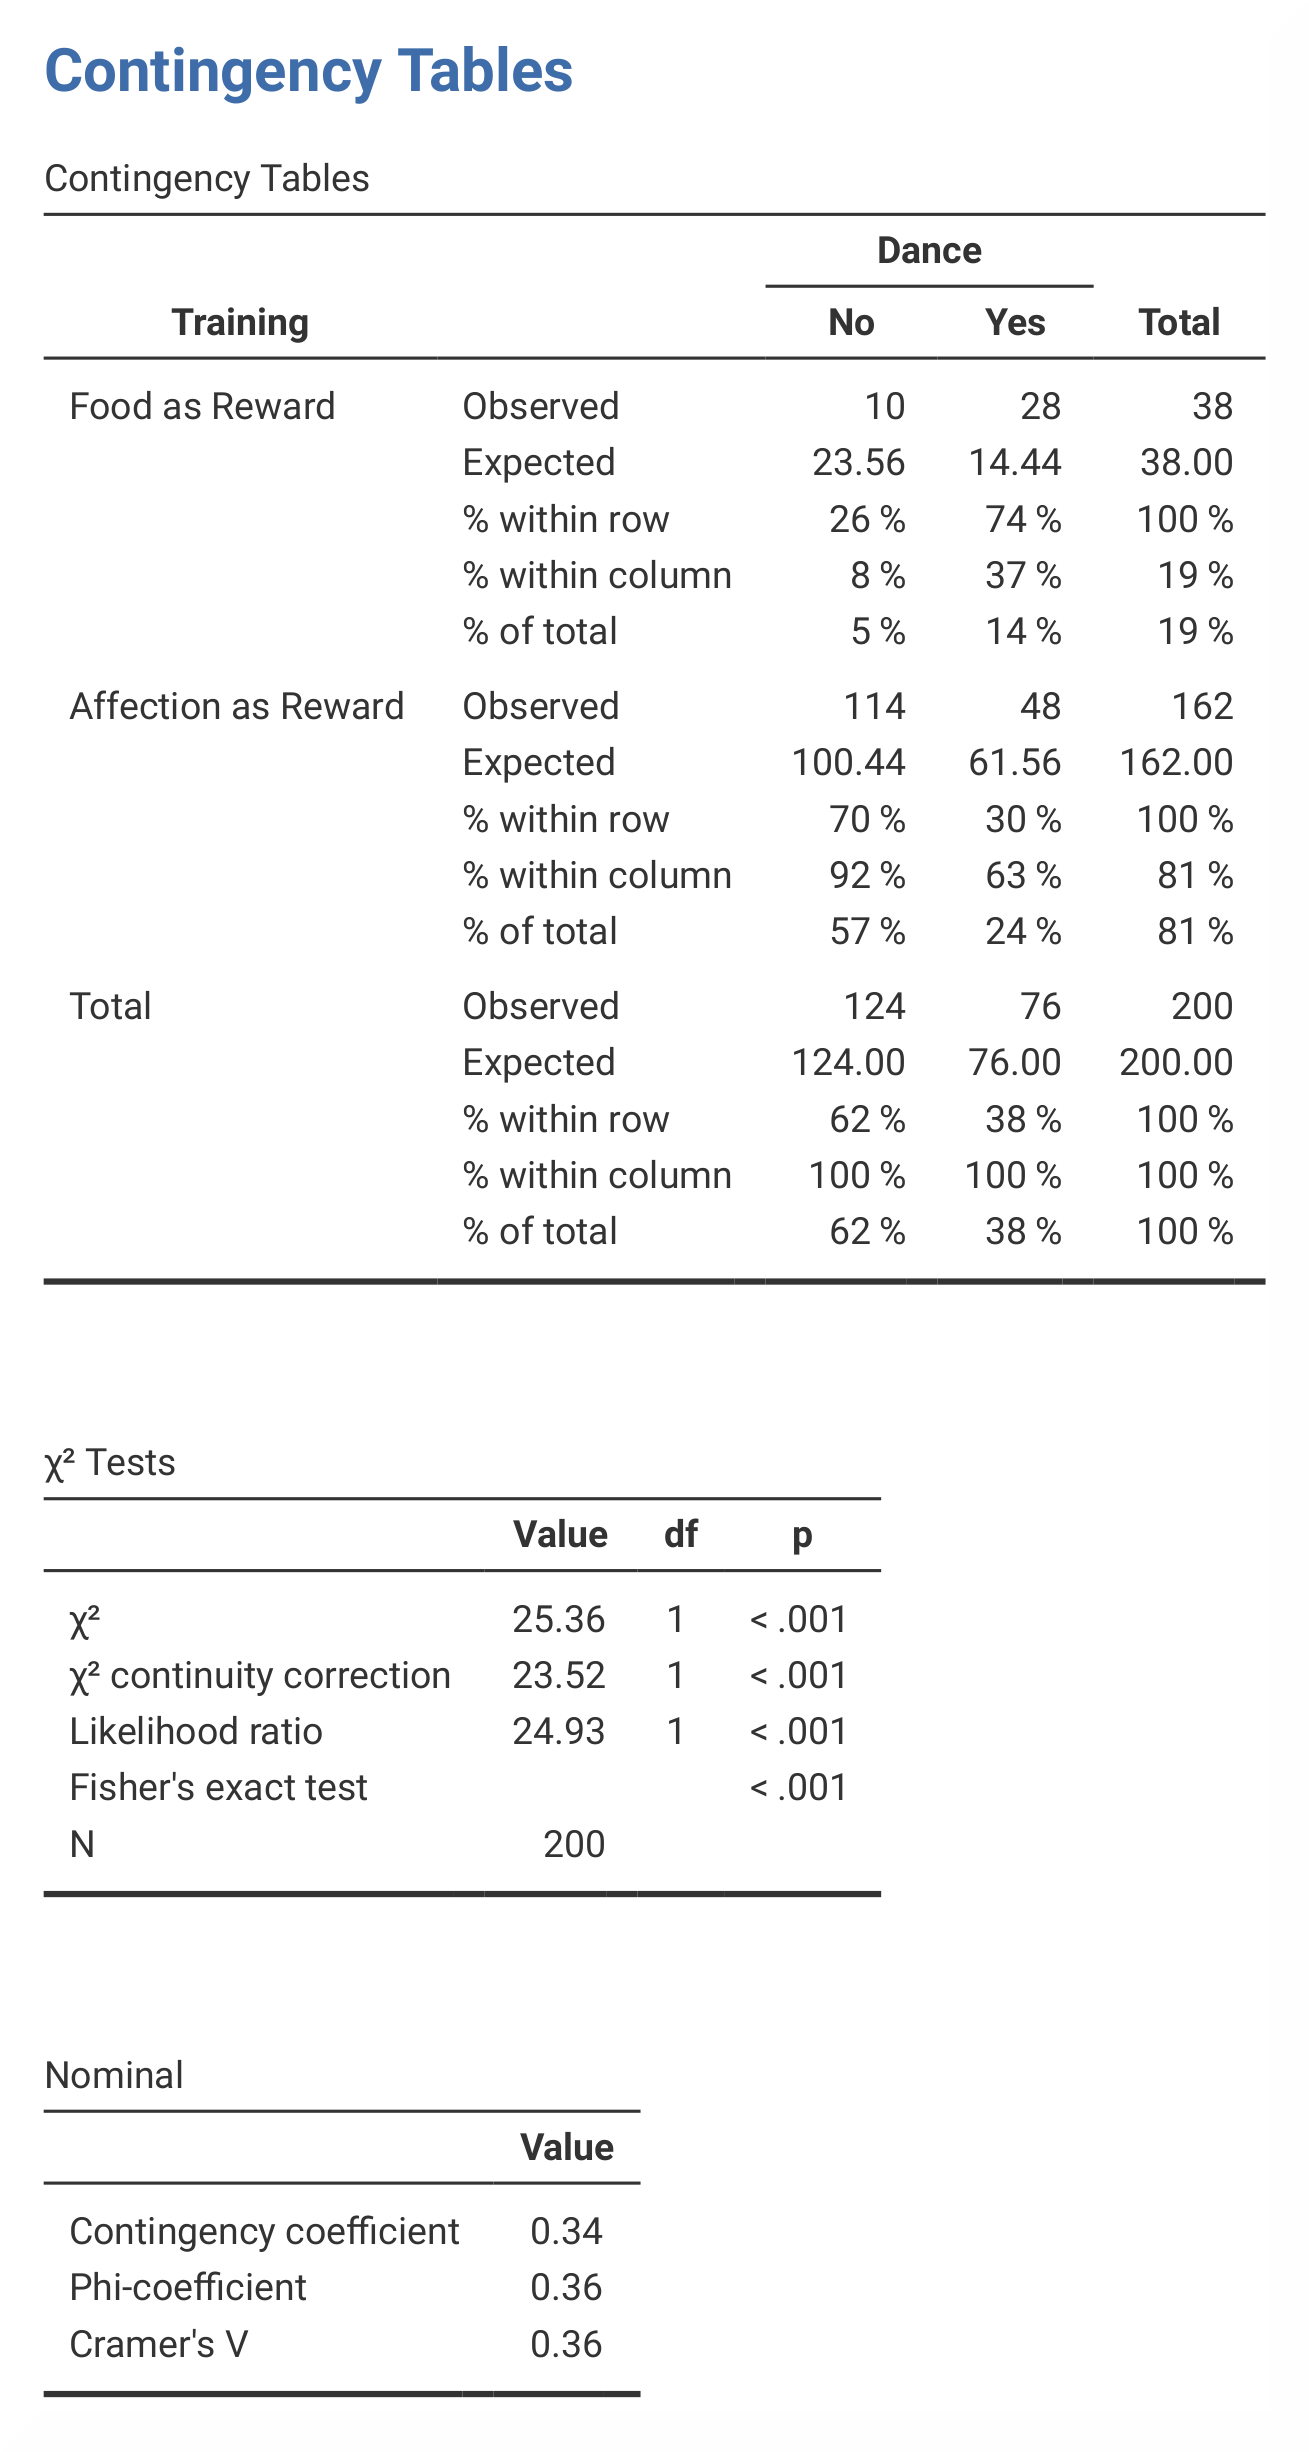
The contingency table in jamovi contains all the same values as in SPSS,
except for Standardized Residual. In jamovi, the chi-square tests are
presented in the table called χ² Tests. In contrast to SPSS, this table
does not include columns for Exact Sig. (2-sided), Exact Sig.
(1-sided) and Point Probability, or a row for Linear-by-Linear
Association. You can find the measures of association in the Nominal
table. Values for Approximate Significance and Exact Significance
are not included in jamovi. |
The only difference between the outputs in SPSS and jamovi is that SPSS produces The numerical values for the statistics are the same: χ² (1, N = 200) = 25.36, p < .001. |
|
| If you wish to replicate those analyses using syntax, you can use the commands below (in jamovi, just copy to code below to Rj). Alternatively, you can download the SPSS output files and the jamovi files with the analyses from below the syntax. | |
WEIGHT BY Frequency.
CROSSTABS
  /TABLES=Training BY Dance
  /FORMAT=AVALUE TABLES
  /STATISTICS=CHISQ CC PHI LAMBDA
  /CELLS=COUNT EXPECTED ROW COLUMN TOTAL SRESID BPROP
  /COUNT ROUND CELL
  /METHOD=EXACT TIMER(5).
|
jmv::contTables(
    formula = Frequency ~ Training:Dance,
    data = data,
    chiSqCorr = TRUE,
    likeRat = TRUE,
    fisher = TRUE,
    contCoef = TRUE,
    phiCra = TRUE,
    exp = TRUE,
    pcRow = TRUE,
    pcCol = TRUE,
    pcTot = TRUE)
|
| SPSS output file containing the analyses | jamovi file containing the analyses |
References
Field, A. (2017). Discovering statistics using IBM SPSS statistics (5th ed.). SAGE Publications. https://edge.sagepub.com/field5e