この節の作者: Rebecca Vederhus, Sebastian Jentschke
From SPSS to jamovi: Linear regression
This comparison shows how a linear model with one predictor is conducted in SPSS and jamovi. The SPSS test follows the description in chapter 9.7 in Field (2017), especially figure 9.13, and output 9.2-9.4. It uses the data set Album Sales.sav which can be downloaded from the web page accompanying the book.
| SPSS | jamovi |
|---|---|
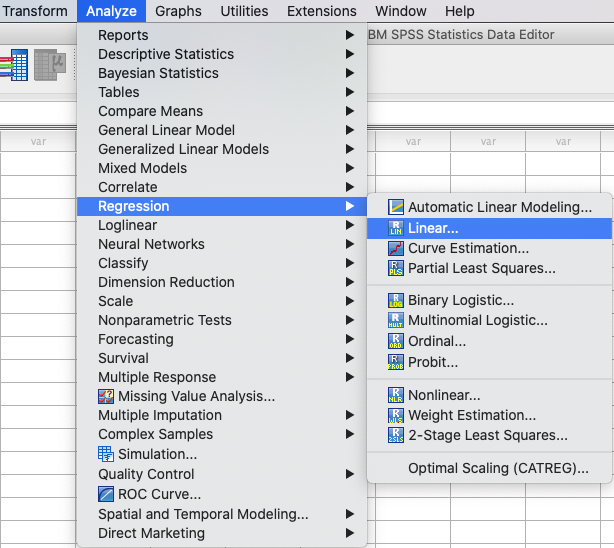
In SPSS, the following steps activates a linear regression: Analyze →
Regression → Linear. |
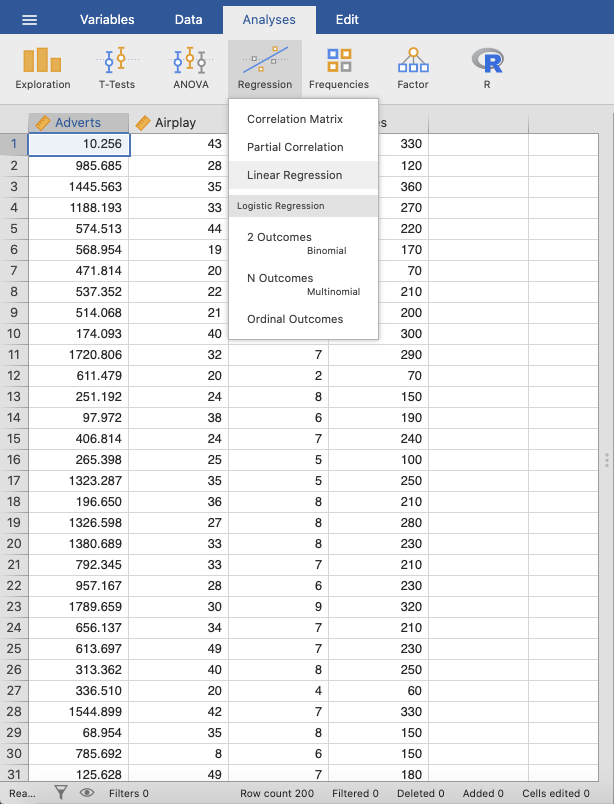
In jamovi, this can be done using: Analyses → Regression → Linear
Regression. |
 |
 |
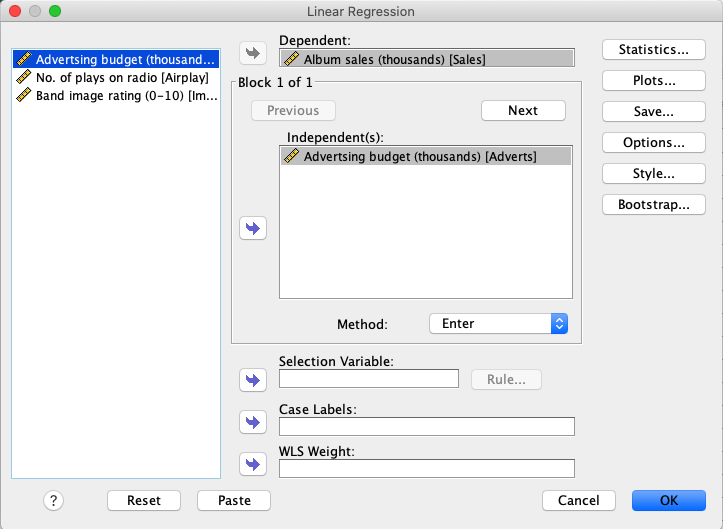
In SPSS, move the variable Sales to the Dependent box and the
variable Adverts to the Independent(s) box. Click Ok. |
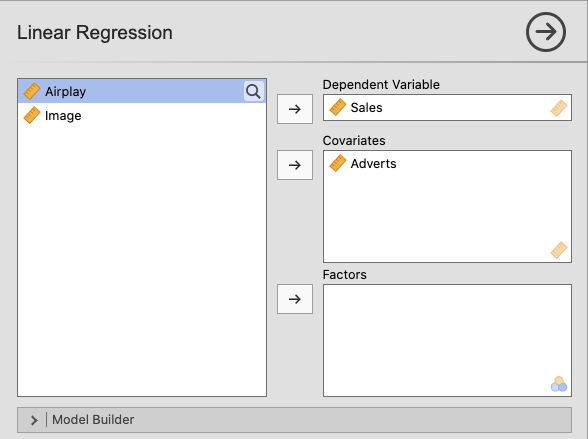
In jamovi, move Sales to the Dependent Variable box and Adverts
to the Covariates box. |
 |
 |
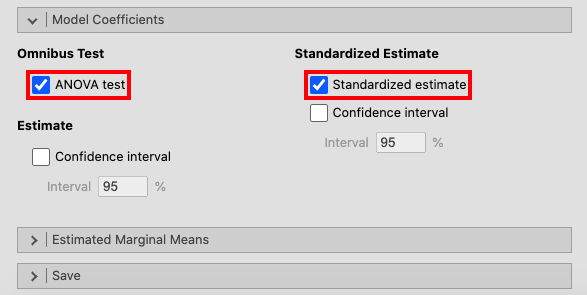
Then, open the Model Coefficients window and press ANOVA test and
Standardized estimate. |
|
 |
|
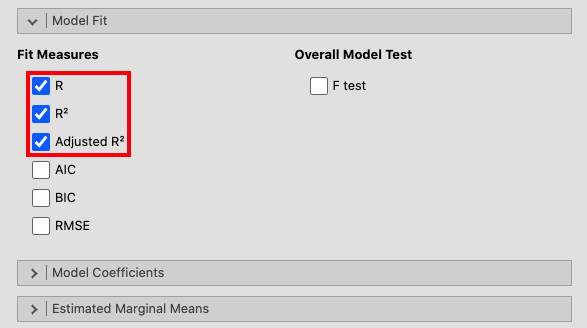
In the window called Model Fit, click R, R² and Adjusted R². |
|
 |
|
| Field (2017) recommends activating a bootstrapping for this analysis, but since this is not an alternative in jamovi it has been left out. | |
The results in SPSS and jamovi are essentially the same. However, jamovi does not display Std. Error of the Estimate and the total Sum of Squares in
the ANOVA output. |
|
 |
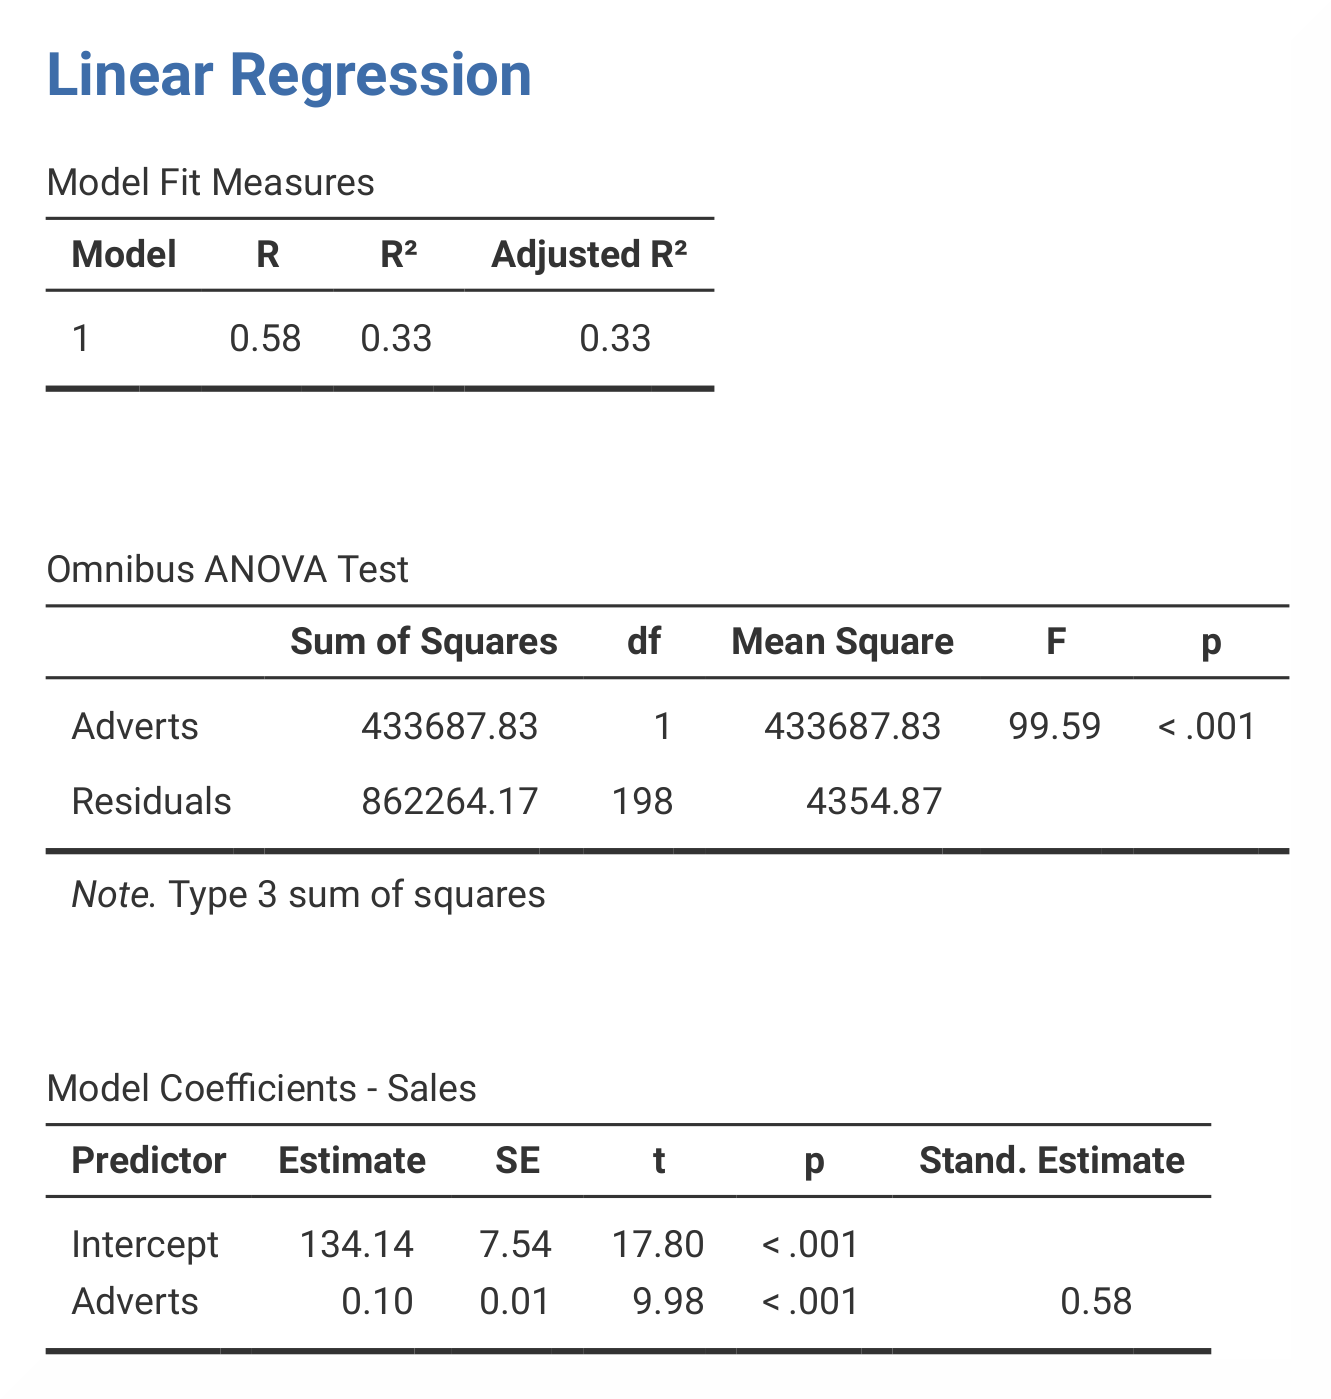 |
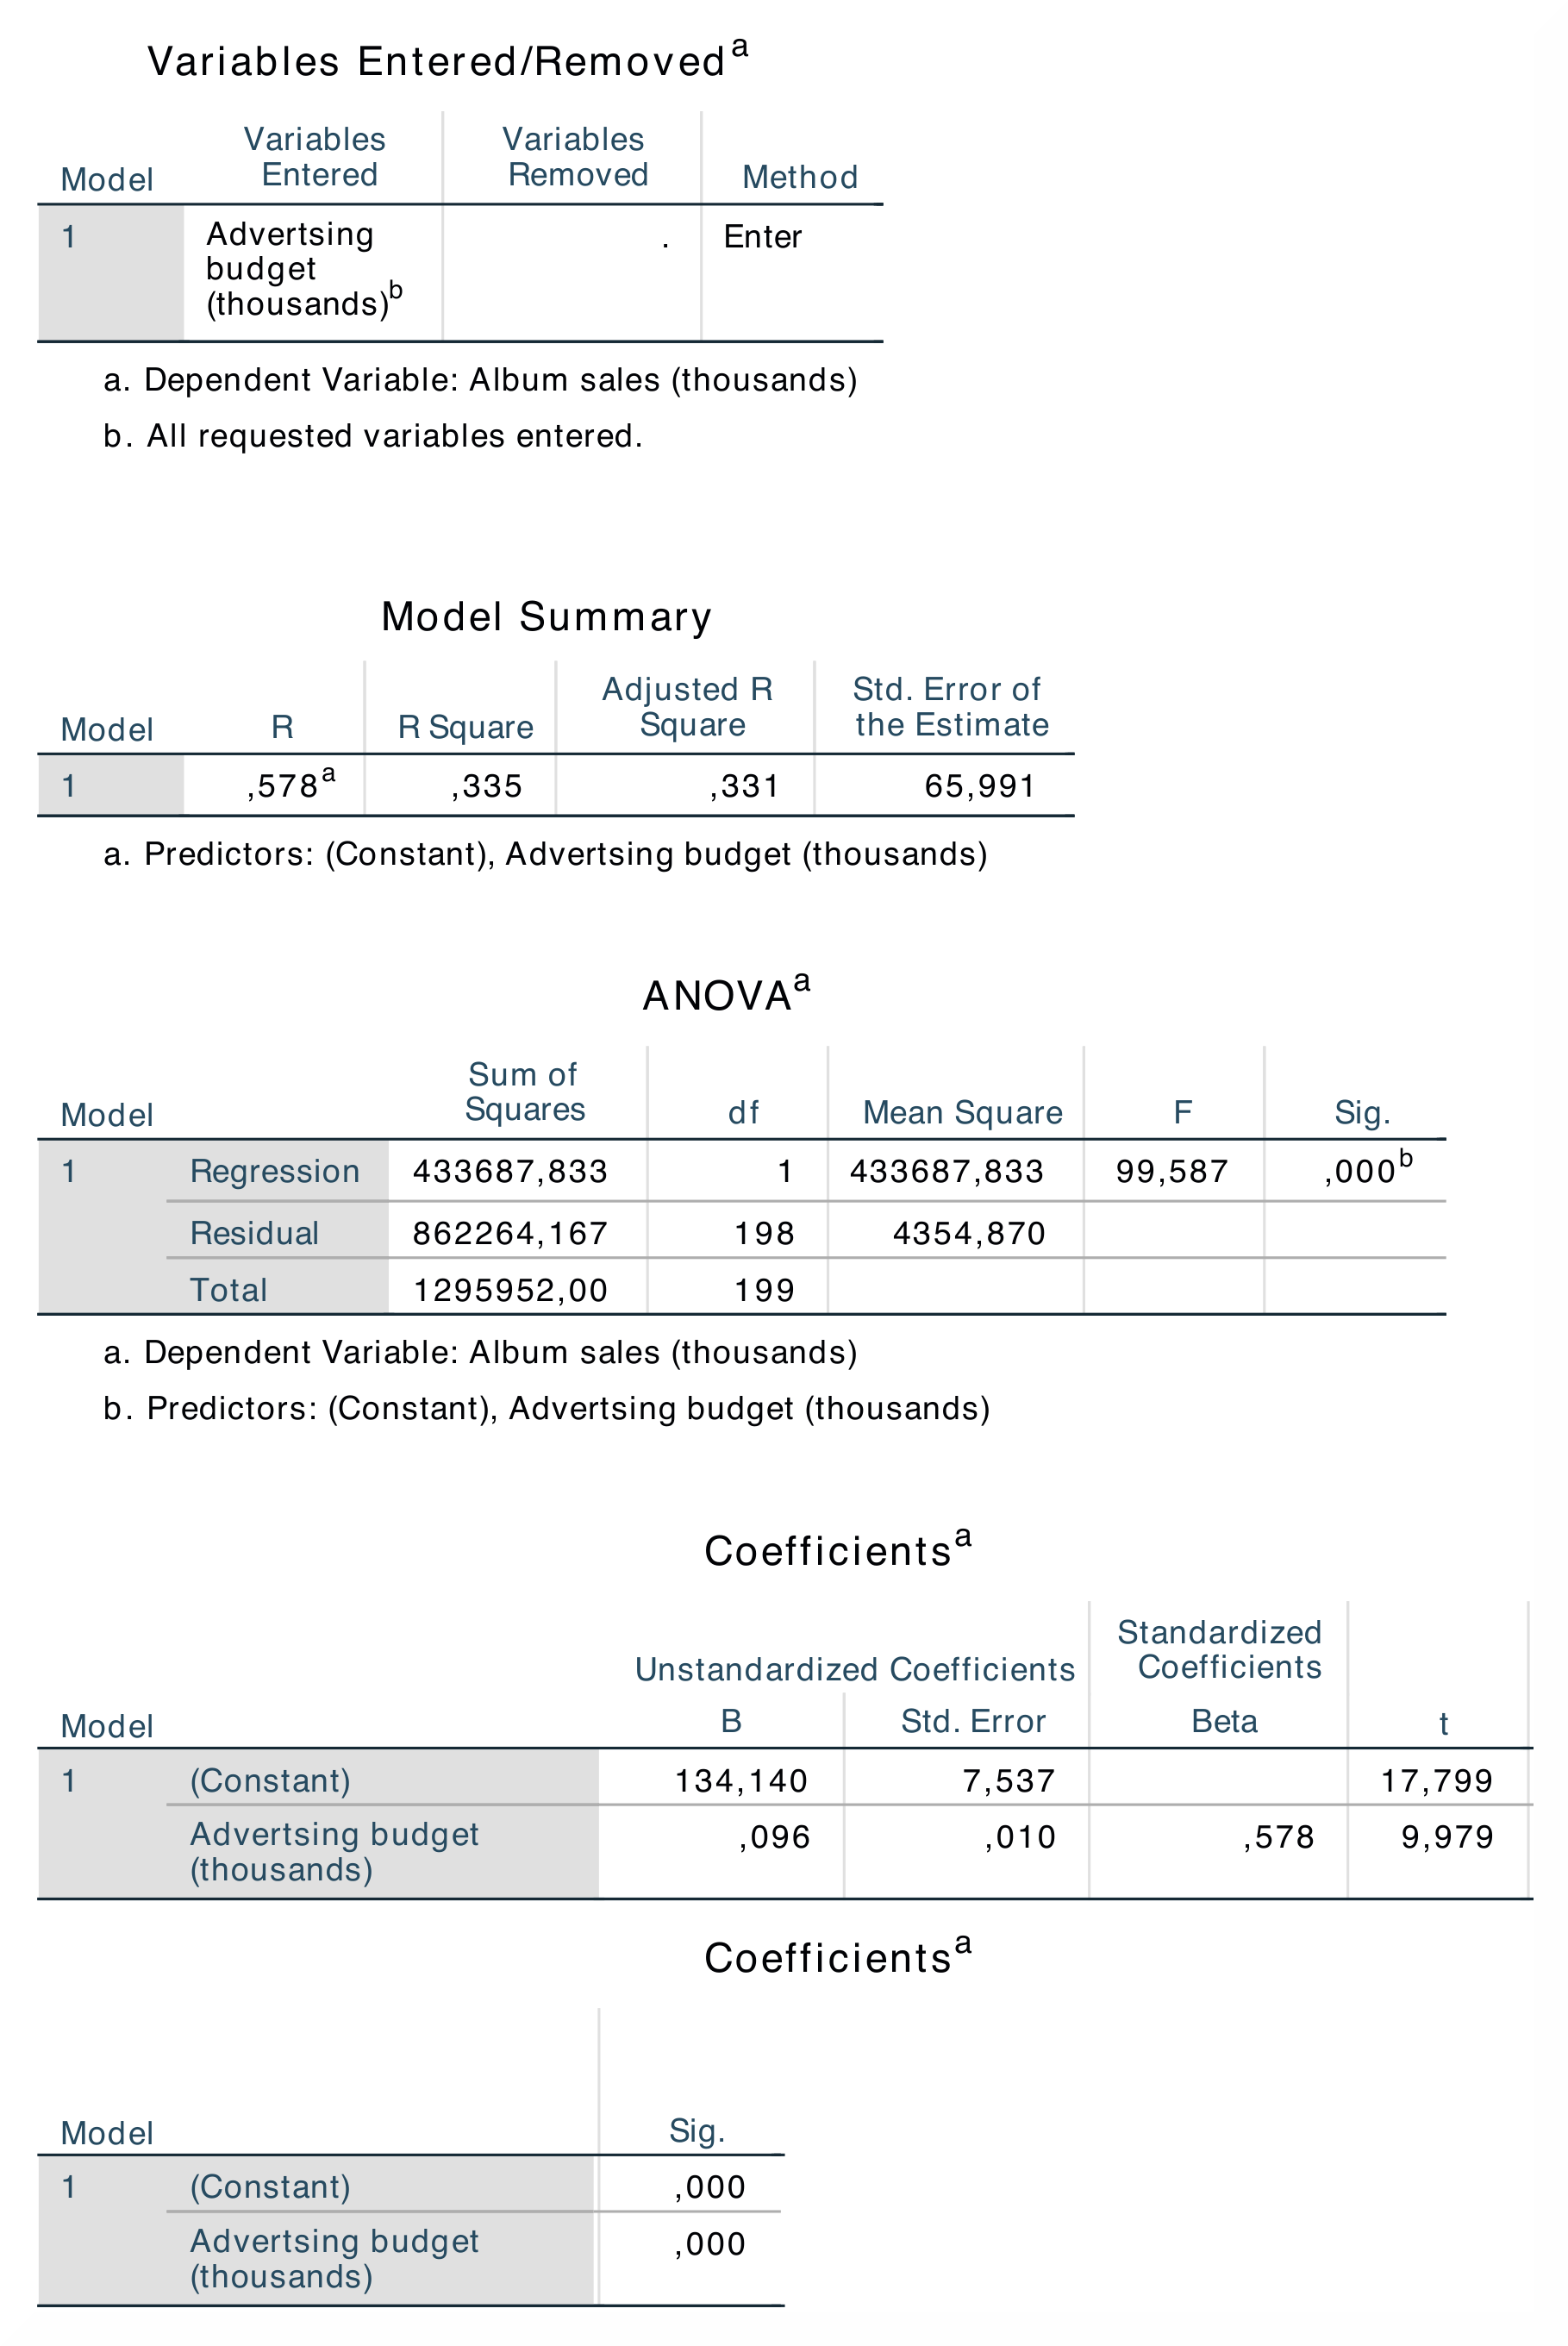
| The table Model Summary shows the value of R (= .578) and R² (= .335) for model. The most important part of the ANOVA table is the value of F (= 99.587), and its significance p (< .001). This shows that this model this model predicts album sales significantly. The Coefficients table shows the beta values and significance of these values. | In jamovi, R and R² are found in the table called Model Fit Measures. The results from the ANOVA is found in the table called Omnibus ANOVA Test, and the beta values are found in the table Model Coefficients – Sales. In jamovi, the beta value is found in the section called Stand. Estimate, which is located at the far right of the table. As this analysis only has one predictor, the R value is the correlation between advertising and album sales. Furthermore, the value of R² indicates that money spent on advertising can account for 33.5% of the variance in sales of albums. |
| The numerical values for the statistics obtained from SPSS and jamovi are identical: R = 0.58, R² = 0.33, F = 99.59, p < .001; β = 0.58, p < .001. | |
| If you wish to replicate those analyses using syntax, you can use the commands below (in jamovi, just copy to code below to Rj). Alternatively, you can download the SPSS output files and the jamovi files with the analyses from below the syntax. | |
REGRESSION
   /MISSING LISTWISE
   /STATISTICS COEFF OUTS R ANOVA
   /CRITERIA=PIN(.05) POUT(.10)
   /NOORIGIN
   /DEPENDENT Sales
   /METHOD=ENTER Adverts.
|
jmv::linReg(
    data = data,
    dep = Sales,
    covs = Adverts,
    blocks = list(
        list("Adverts")),
    refLevels = list(),
    r2Adj = TRUE,
    anova = TRUE,
    stdEst = TRUE)
|
| SPSS output file containing the analyses | jamovi file containing the analyses |
References
Field, A. (2017). Discovering statistics using IBM SPSS statistics (5th ed.). SAGE Publications. https://edge.sagepub.com/field5e