この節の作者: Rebecca Vederhus, Sebastian Jentschke
From SPSS to jamovi: Analysis of Covariance (ANCOVA)
This comparison shows how an analysis of covariance which excludes the covariate is conducted in SPSS and jamovi. The SPSS test follows the description in chapter 13.6.1 - 13.6.4 in Field (2017), especially figure 13.5 - 13.7 (excluding the covariate in figure 13.5 andOptionsin figure 13.7) and output 13.5. It uses the data set Puppy Love.sav which can be downloaded from the web page accompanying the book.
| SPSS | jamovi |
|---|---|
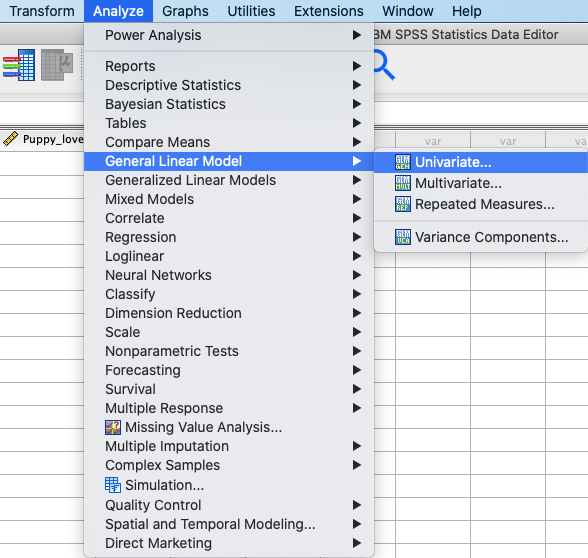
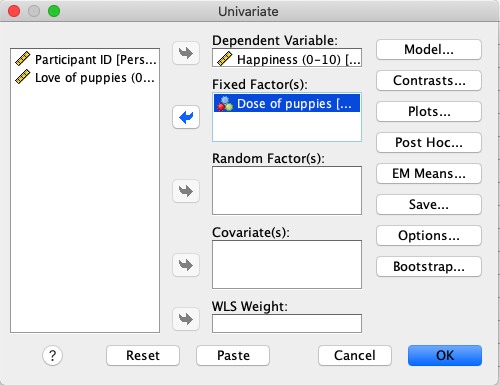
In SPSS, you can run this test using: Analyze → General Linear Model
→ Univariate. |
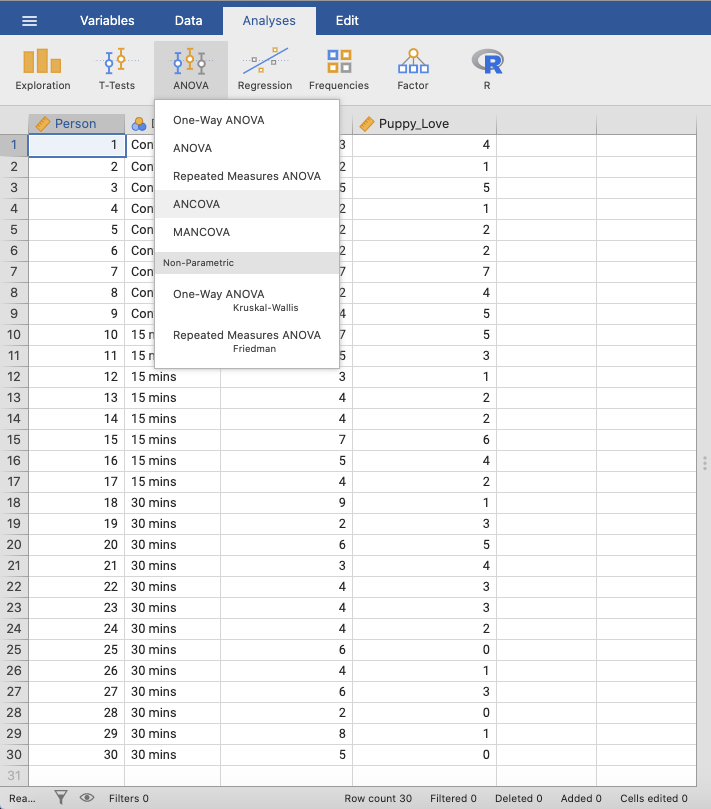
In jamovi, you can create an analysis of covariance using: Analyses →
ANOVA → ANCOVA. |
 |
 |
In SPSS, move Happiness to the Dependent Variable box and Dose
to the Fixed Factor(s) box. |
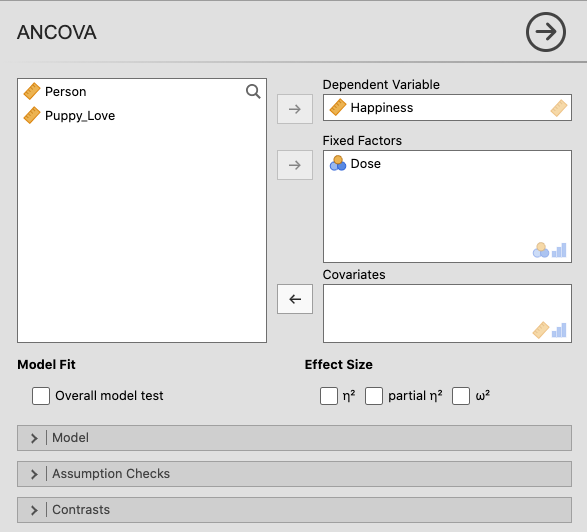
In jamovi, move Happiness to Dependent Variable and Dose to
Fixed Factors. |
 |
 |
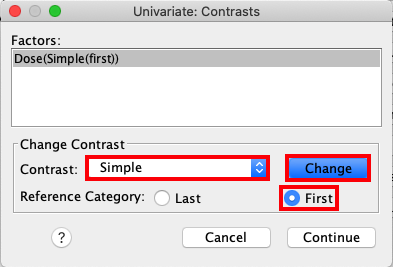
Open the dialog box called Contrasts, and click the drop-down menu to
select Simple. Change the Reference Category to First, and press
press Change. |
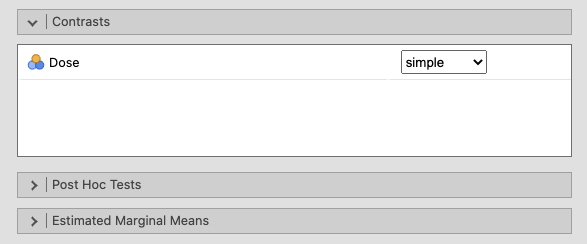
Open the Contrasts window, and select simple from the drop-down menu. |
 |
 |
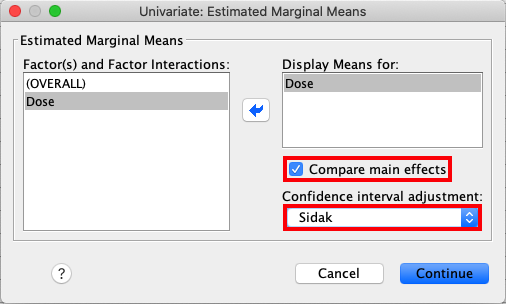
Select EM Means from the sidebar. Move Dose to the box called
Display Means for:, press Compare main effects and select Sidak
in the drop-down list. |
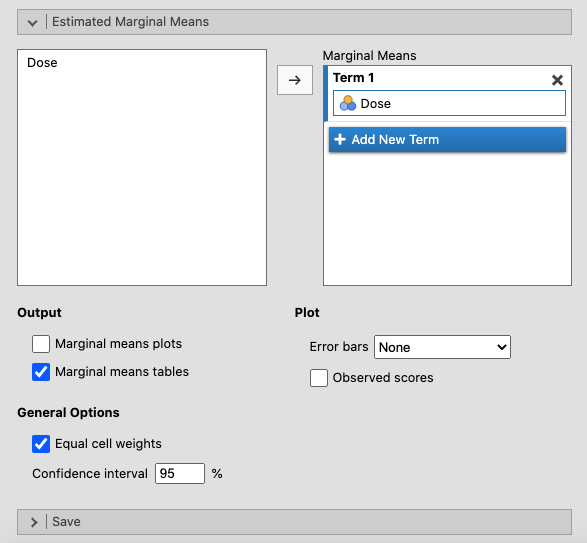
In the Estimated Marginal Means window, move Dose to Term 1. Tick
Tick the box for Marginal means tables as shown in the picture below. |
 |
 |
| The results are essentially the same in SPSS and jamovi, except that SPSS provides more output tables than jamovi. | |
|
 |
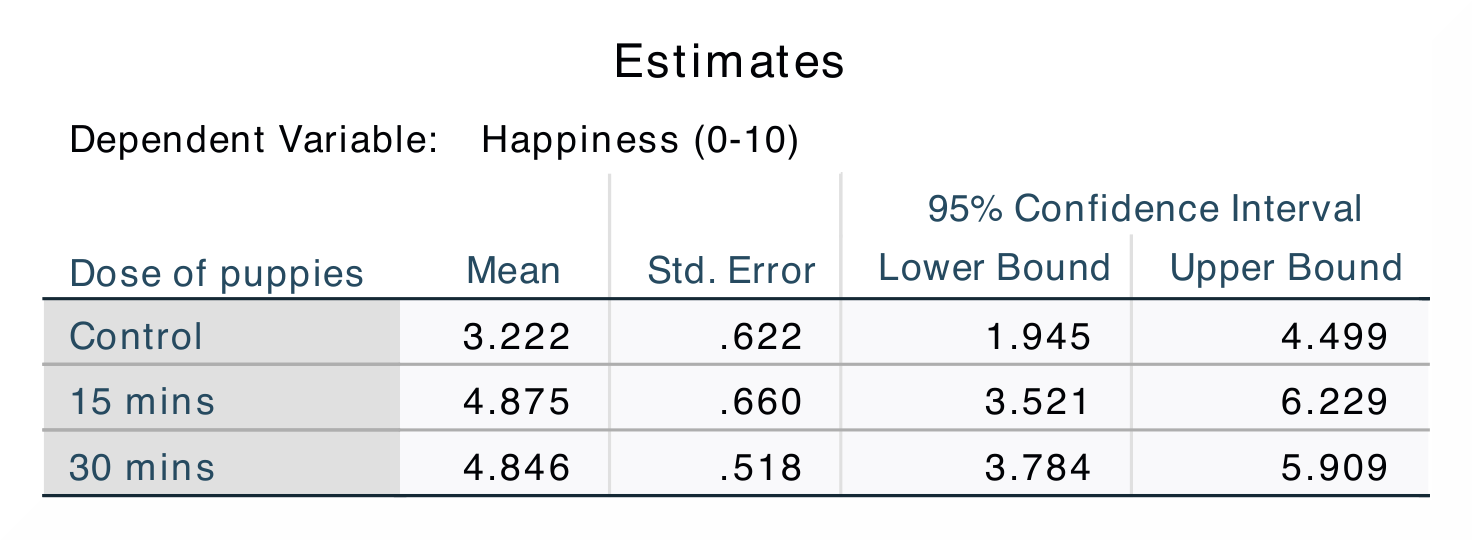
In SPSS, you can find the adjusted values of the group means in the
Estimates table. By looking at the Mean you can find out if there are
any changes in happiness levels if there is an increase in puppy exposure.
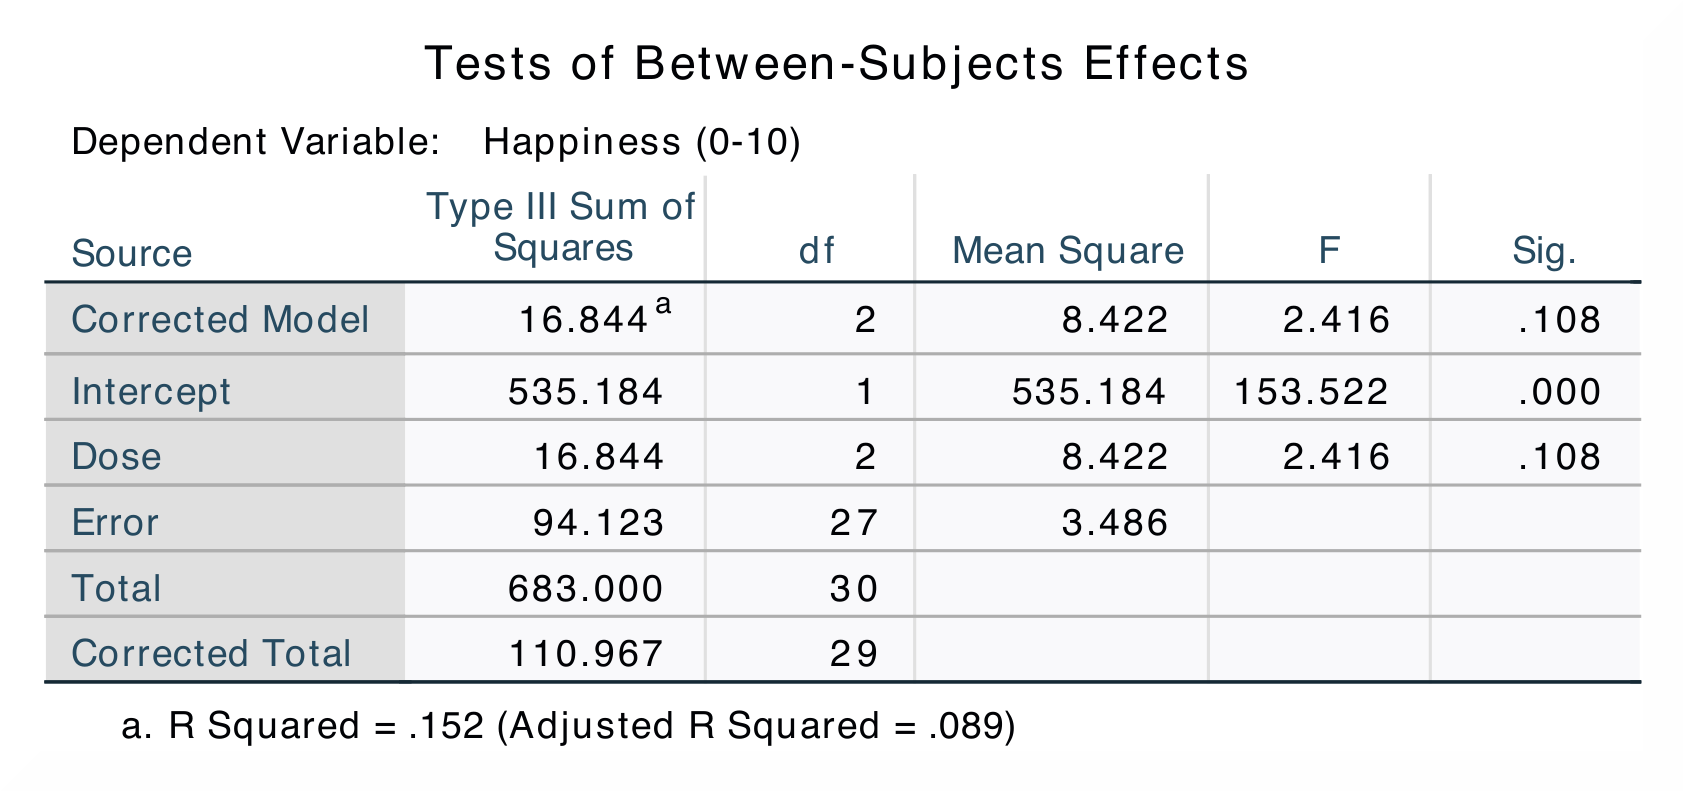
The Tests of Between-Subjects Effects table shows the sum of squares for
the dose of puppies, and this tells us how many units of variance this factor
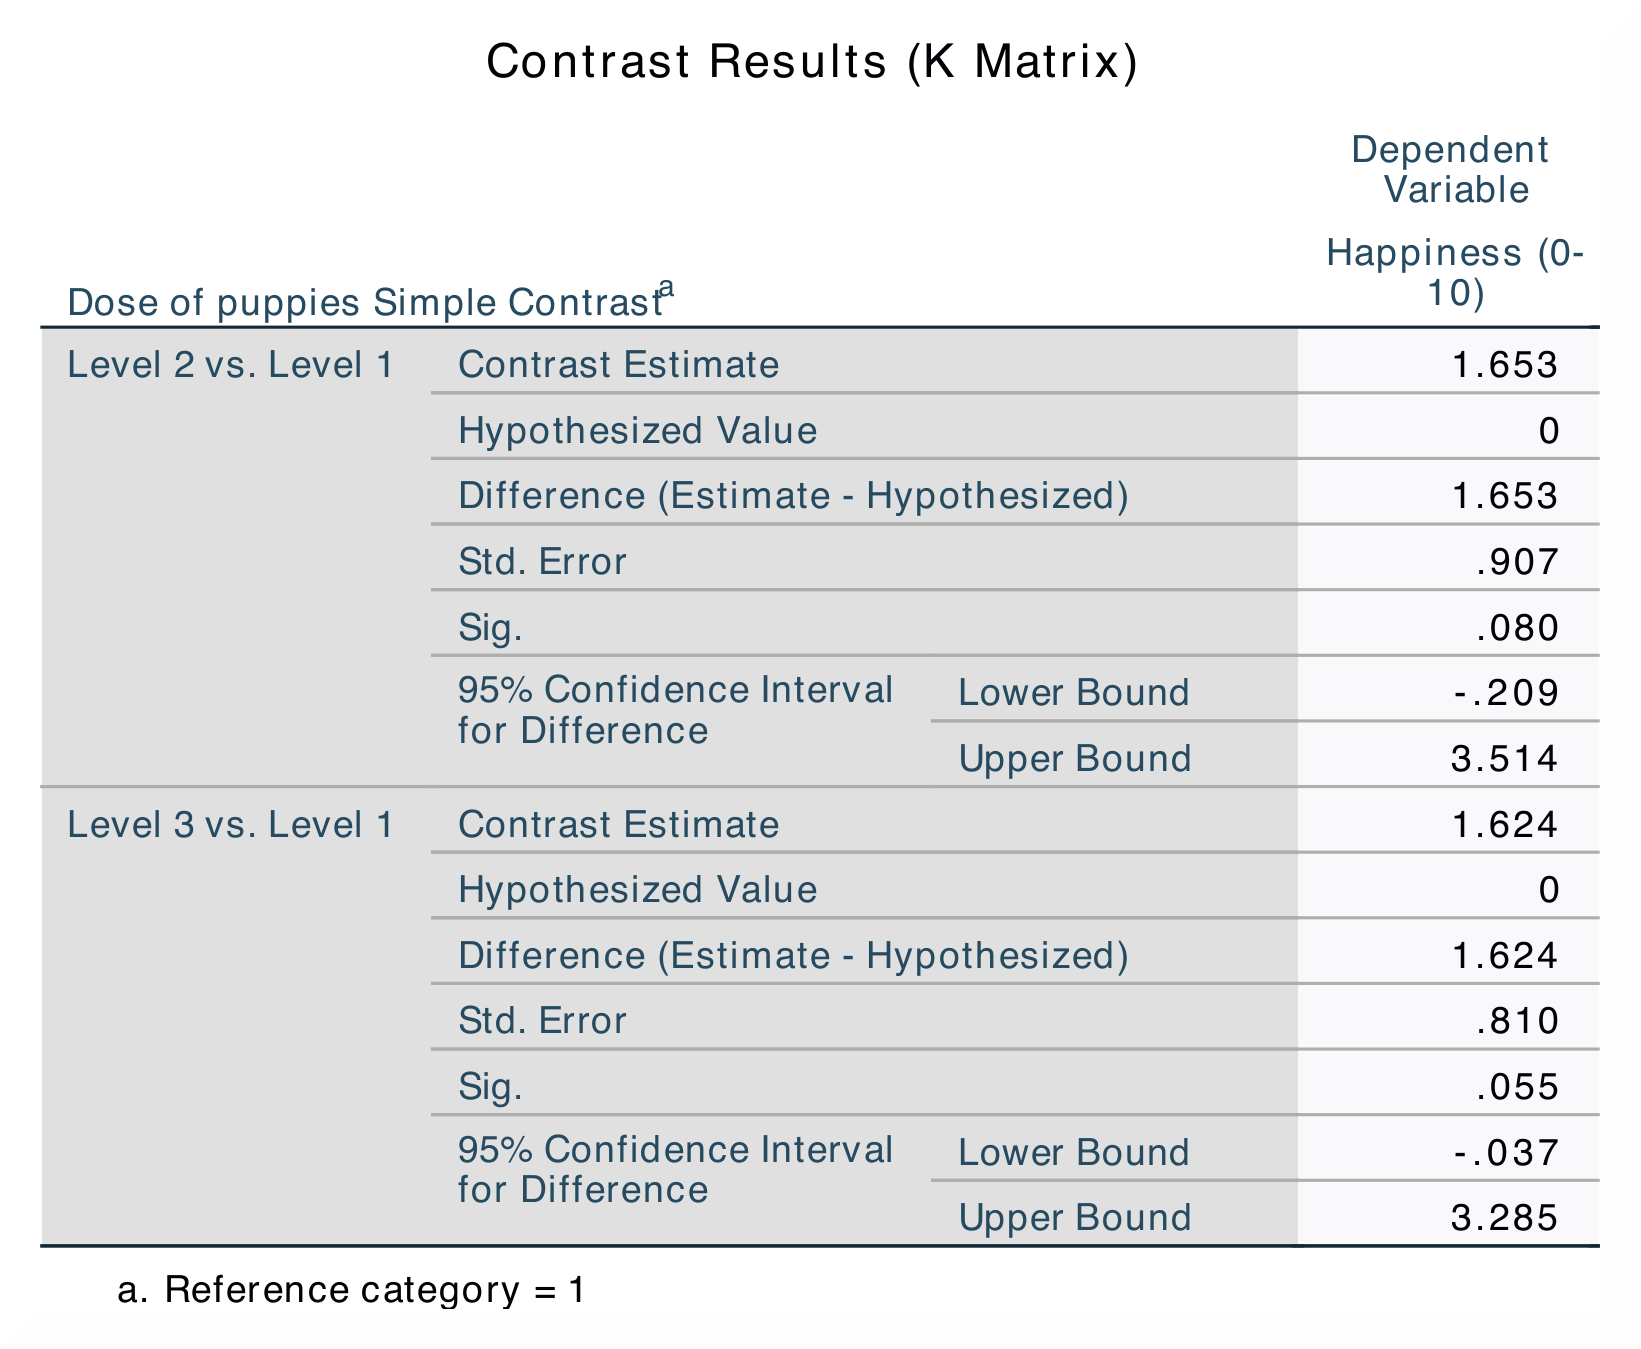
accounts for. In the Contrast Results (K Matrix) table, level 2 (15 mins)
is compared with level 1 (control) and then level 3 (30 mins) is compared
with level 1 (control). Here, the group differences are indicated by standard
error, a difference value and a p-value. |
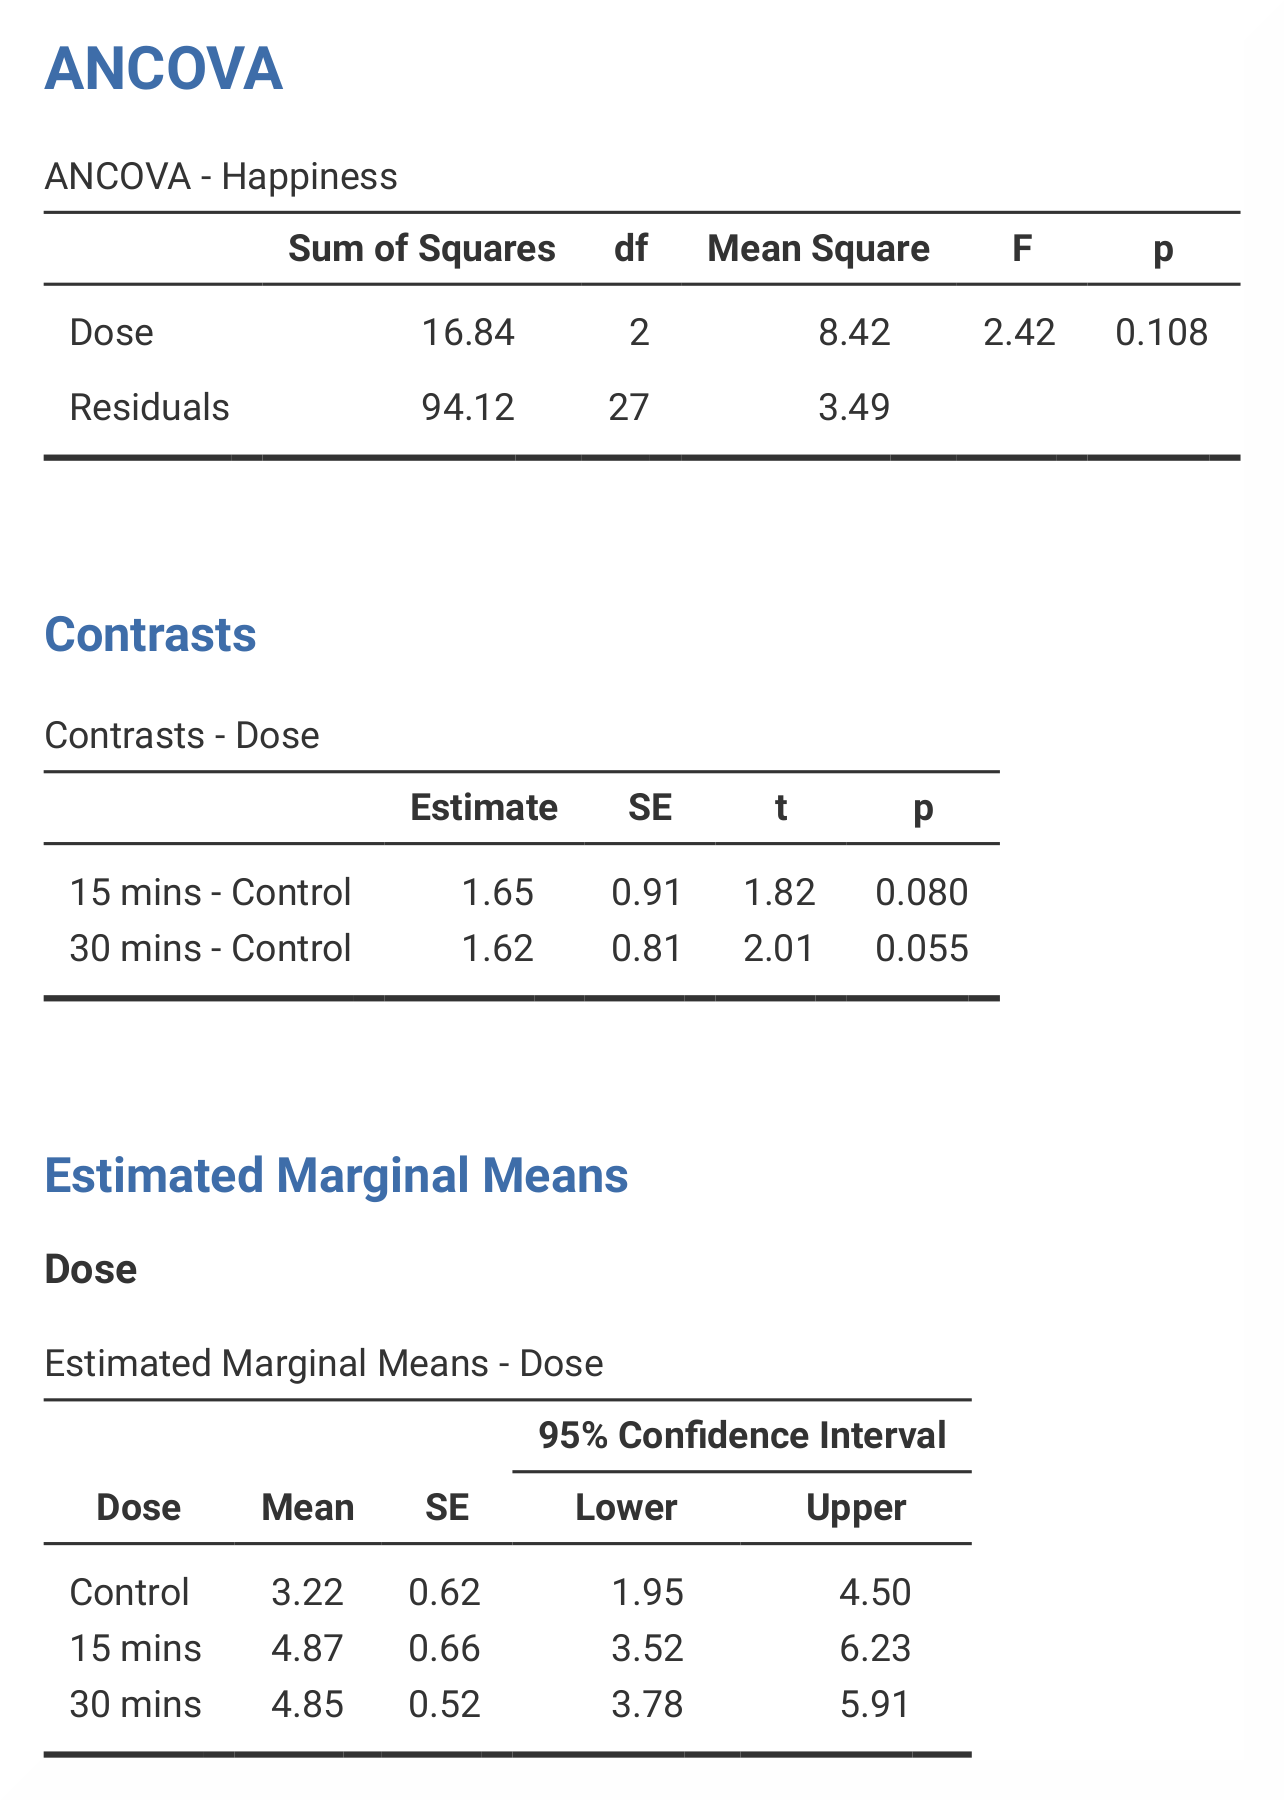
In jamovi, the adjusted values can be found in the table called Estimated
Marginal Means – Dose. This table looks exactly the same as the equivalent
table in SPSS. Sum of squares are found in the ANCOVA – Happiness table.
These tables differ slightly in SPSS and in jamovi, as jamovi only gives
results for Dose, Puppy_love and Residuals. The contrast analysis
in jamovi also does not provide all of the values that the SPSS analysis
does. However, all important information (that you typically would report)
is included. |
jamovi does not include the values for the The numerical values for these analyses are the same: SS*<sub>Dose</sub> = 16.84; *M*<sub>Control</sub> = 3.22, *M*<sub>15mins</sub> = 4.87, *M*<sub>30mins</sub> = 4.85; contrast 1, *p = 0.080; contrast 2, p = 0.055. |
|
| If you wish to replicate those analyses using syntax, you can use the commands below (in jamovi, just copy to code below to Rj). Alternatively, you can download the SPSS output files and the jamovi files with the analyses from below the syntax. | |
UNIANOVA Happiness BY Dose
  /CONTRAST(Dose)=Simple(1)
  /METHOD=SSTYPE(3)
  /INTERCEPT=INCLUDE
  /EMMEANS=TABLES(Dose) COMPARE ADJ(SIDAK)
  /CRITERIA=ALPHA(0.05)
  /DESIGN=Dose.
|
jmv::ancova(
    formula = Happiness ~ Dose,
    data = data,
    contrasts = list(list(var = "Dose", type = "simple")),
    emMeans = ~ Dose,
    emmPlots = FALSE,
    emmPlotError = "none",
    emmTables = TRUE)
|
| SPSS output file containing the analyses | jamovi file containing the analyses |