この節の作者: Sebastian Jentschke
How do I identify outliers and filter them out from being used in analyses?
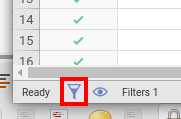
- open the
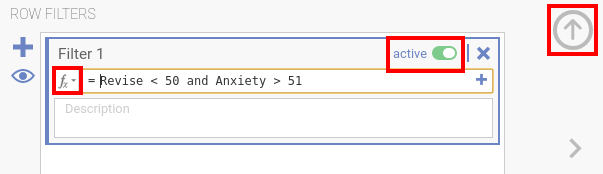
Datatab and selectFilter(either by using the symbol in the icon bar or the one in the bottom-left corner of the jamovi window)in order to access functions, press thefxicon in the filter settingsthere also is a switch where you can activate or deactivate the filter (see the comment in red below)you close the filter settings by pressing the arrow in the top-right corner - there are three large approaches, to exclude outliers:
- based upon z-scores (the absolute value should be larger 3.3; this equals to a probability of 0.1% = 1 / 1000; based upon a standard normal distribution ~ parametric)
- based upon the IQR (like in a box plot; based upon ranks and quantiles ~ non-parametric)
- based on the Mahalanobis distance (multivariate outliers)
for 1. and 2., there exist functions in jamovi (see next bullet points), for 3. you have to use R-code (decribed two bullet point below); for 2. you could also do it visually (three bullet points below) - you can either use an function-based selection; the functions below filter out lines based on either the z-scores (first line), the interquartile range (IQR, second line) or by excluding certain rows / row numbers (e.g., based upon the output from the calculation of the Mahalanobis distance further below; third line):
MAXABSZ([VARIABLE1], [VARIABLE2], …)
MAXABSIQR([VARIABLE1], [VARIABLE2], …)
IFMISS(MATCH(ROW(), [ROWNUMBER 1], [ROWNUMBER 2], …), 1, 0)
 the following code example detects multivariate outliers based upon the Mahalanobis distance (remember to adjust the variable names in VL)
# this list should contain the names of your INDEPENDENT VARIABLES
# you should not include your dependent variables
# if you already use a filter set it to inactive
# hint: you can get the names of your variable with names(data)
# the syntax is adjusted for jamovi (the data frame is called data,
# but can easily be used within R by just changing data to the name of your data frame
VL = c('dan.sleep', 'baby.sleep', 'day')
# brief explanation: the code calculates the Mahalanobis distance for all variables in VL,
# then calculates the p-value (pchisq) and show lines with variables that had a p-value < 0.001
row.names(data)[
    pchisq(unname(
        mahalanobis(data[, VL], colMeans(data[, VL]), cov(data[, VL]))),
        df=length(VL), lower.tail=FALSE) < 0.001]
the output from theR-code tells you which lines you should de-selectyou use the scripts within the Rj editor, just copy-and-paste them and run them by hitting the ►-button (the little green triangle) - the filter conditions can then be combined using boolean
and/or:MAXABSZ([VARIABLE1], [VARIABLE2], …) < 3.3 and MAXABSIQR([VARIABLE1], [VARIABLE2], …) < 3 and IFMISS(MATCH(ROW(), [ROWNUMBER 1], [ROWNUMBER 2], …), 1, 0)
- instead of using the second line (
MAXABSIQR) you could also de-select cases by excluding their respective row numbers in the dataset (as in the third line; you would then visually check the outliers in the box-plots underDescriptives, ensuring that the tick boxLabel outliersis set and exclude the row numbers that are marked as outliers)