この節の作者: Rebecca Vederhus, Sebastian Jentschke
From SPSS to jamovi: Non-parametric analyses
This comparison shows how a Kruskal-Wallis test is conducted in SPSS and jamovi. The SPSS test follows the description in chapter 7.6.4 in Field (2017), especially figure 7.13 and output 7.5 - 7.6. It uses the data set Soya.sav which can be downloaded from the web page accompanying the book.
| SPSS | jamovi |
|---|---|
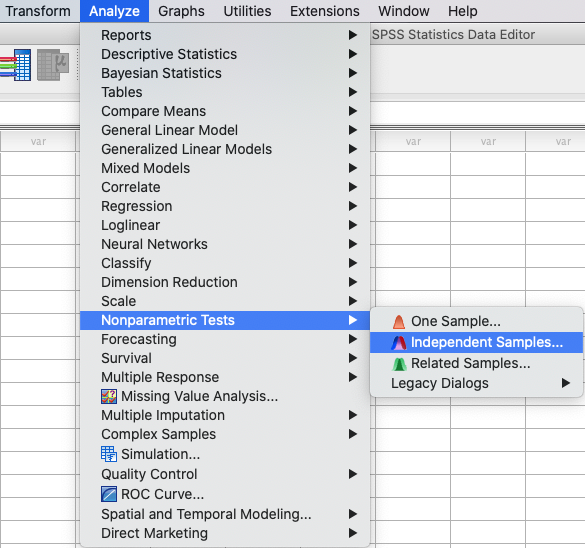
In SPSS, a Kruskal-Wallis test can be run using: Analyze →
Nonparametric Tests `` → ``Independent Samples. |
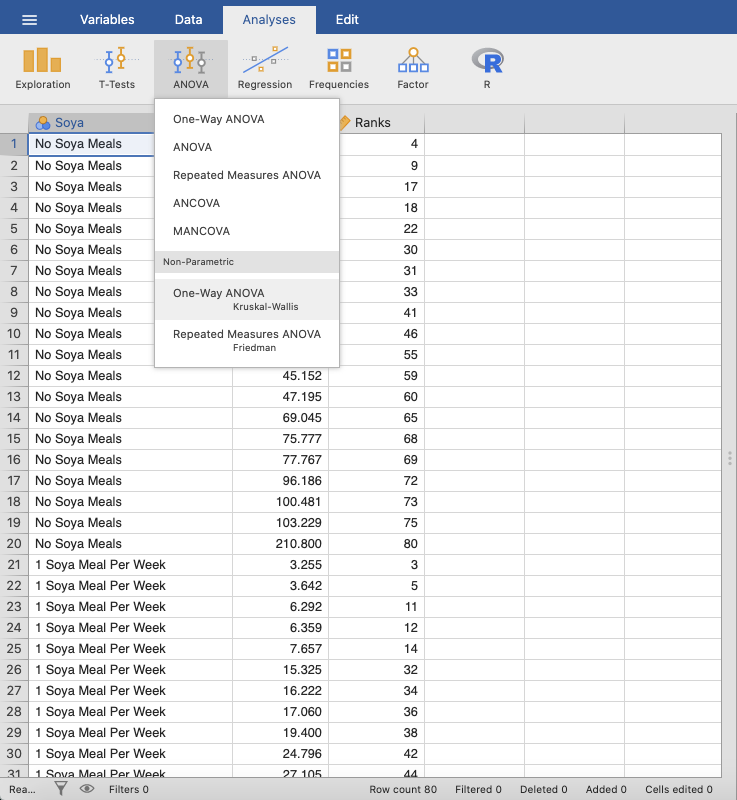
In jamovi this is done using the following steps: Analyses → ANOVA →
One-Way ANOVA Kruskal-Wallis. |
 |
 |
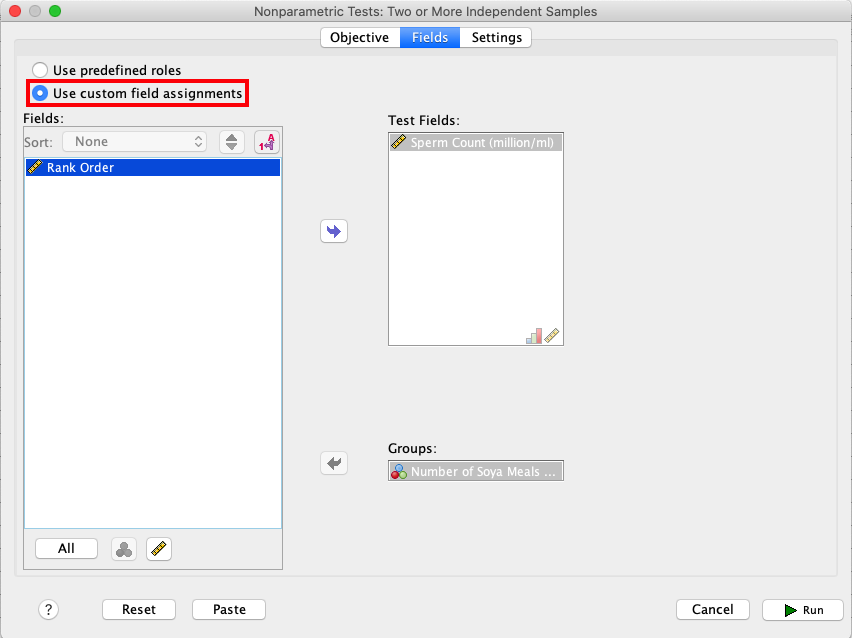
In SPSS, choose Fields from the menu. Then, click Use custom field
assignments and move the Sperm variable to Test Fields, and the
variable Soya to Groups. |
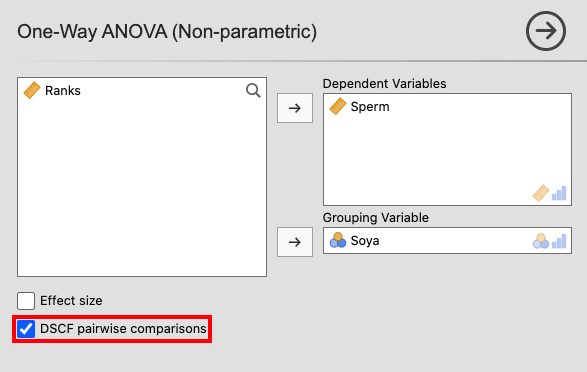
In jamovi, move Sperm to the Dependent Variables box and Soya to
the Grouping Variable box. Then, tick the box for DSCF pairwise
comparisons. |
 |
 |
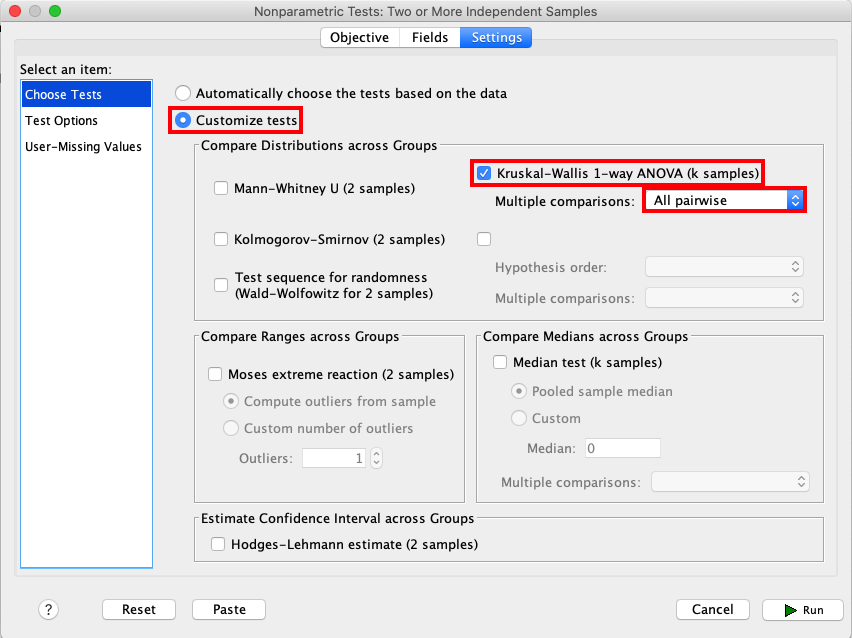
Open the Settings window, and click Customize tests. Tick the box for
Kruskal-Wallis 1-way ANOVA (k samples), and use the drop-down menu next
to Multiple comparisons to select All pairwise. |
|
 |
|
| When comparing the outputs, the results in SPSS and jamovi are slightly different. In addition, the results from jamovi appear much clearer. | |
|
 |
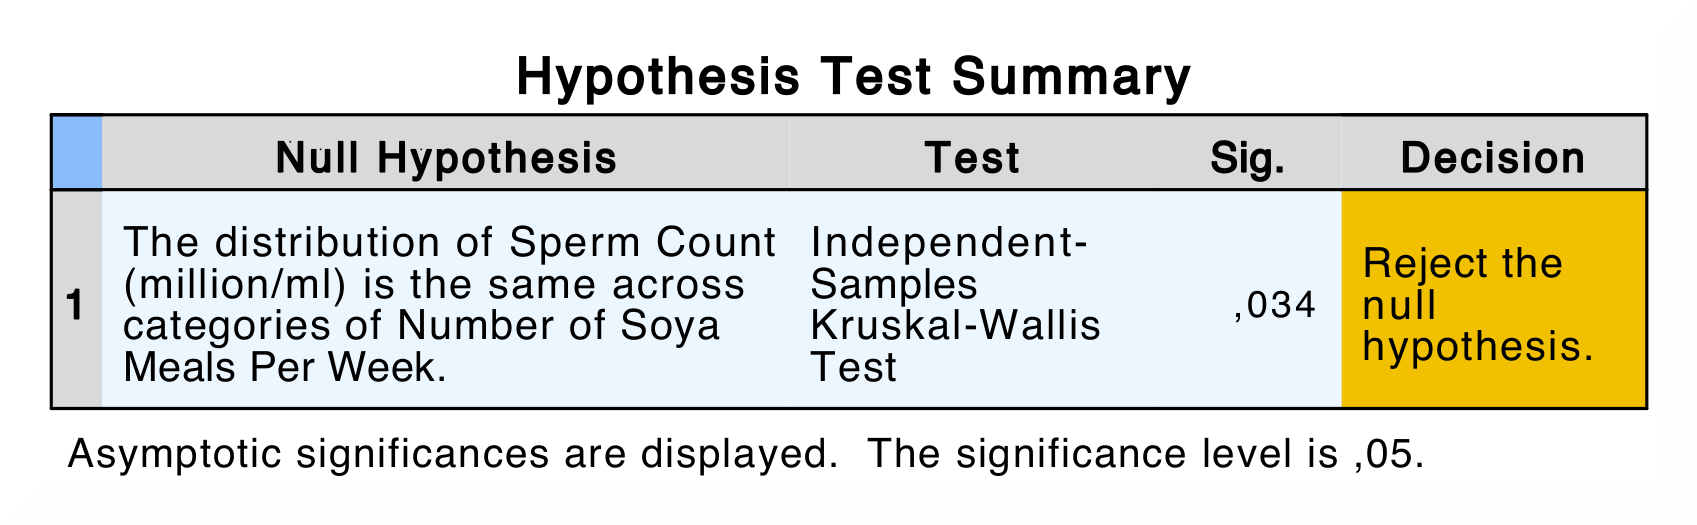
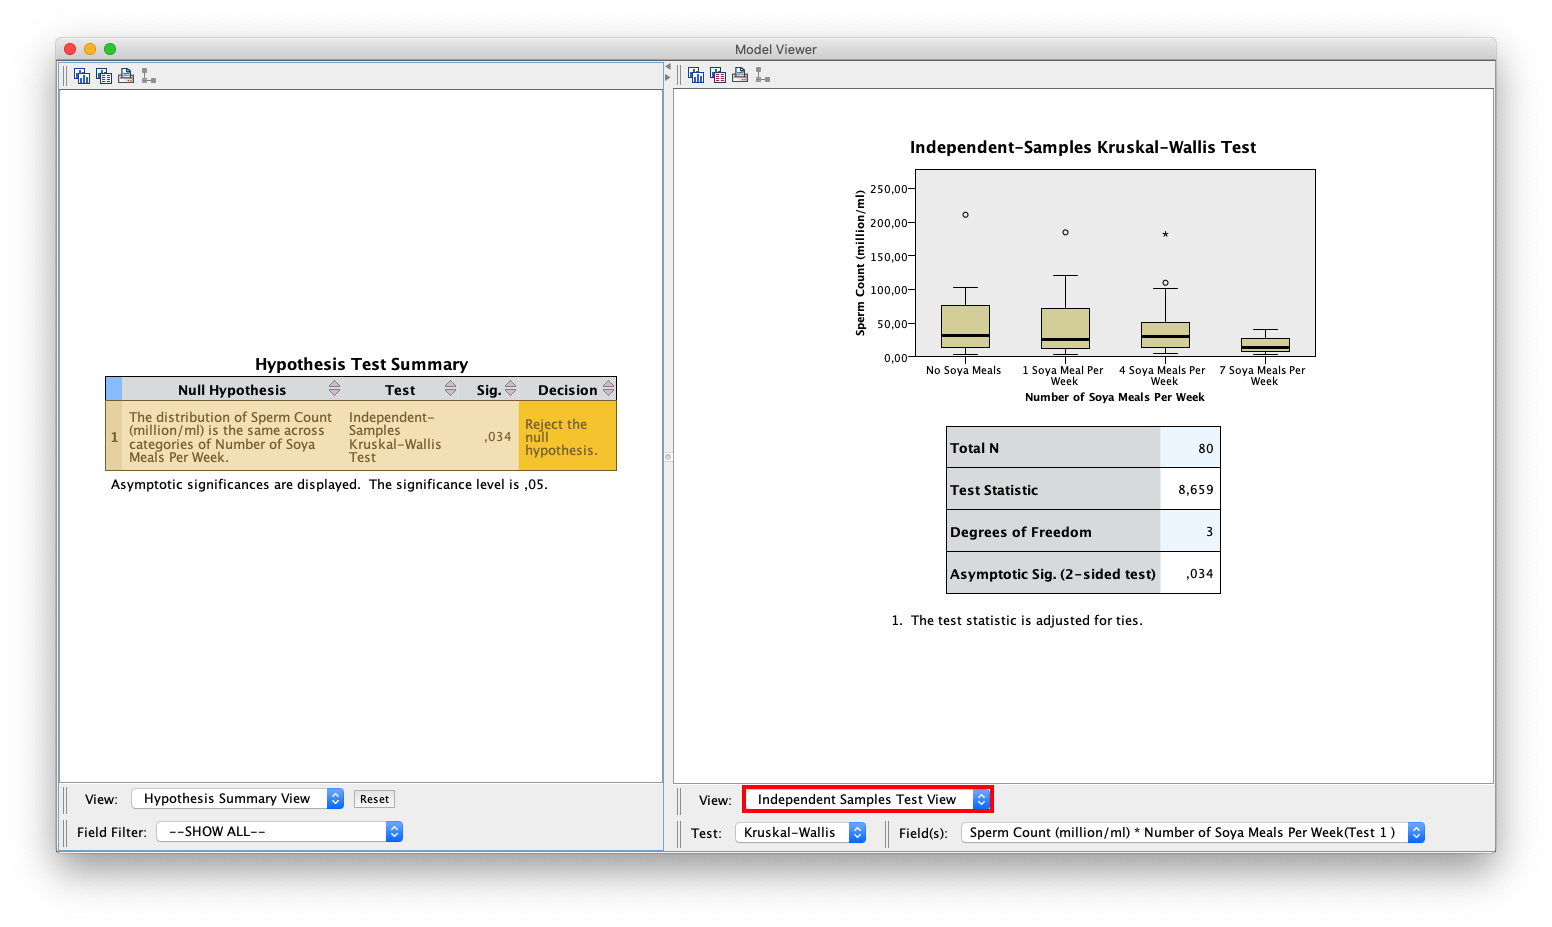
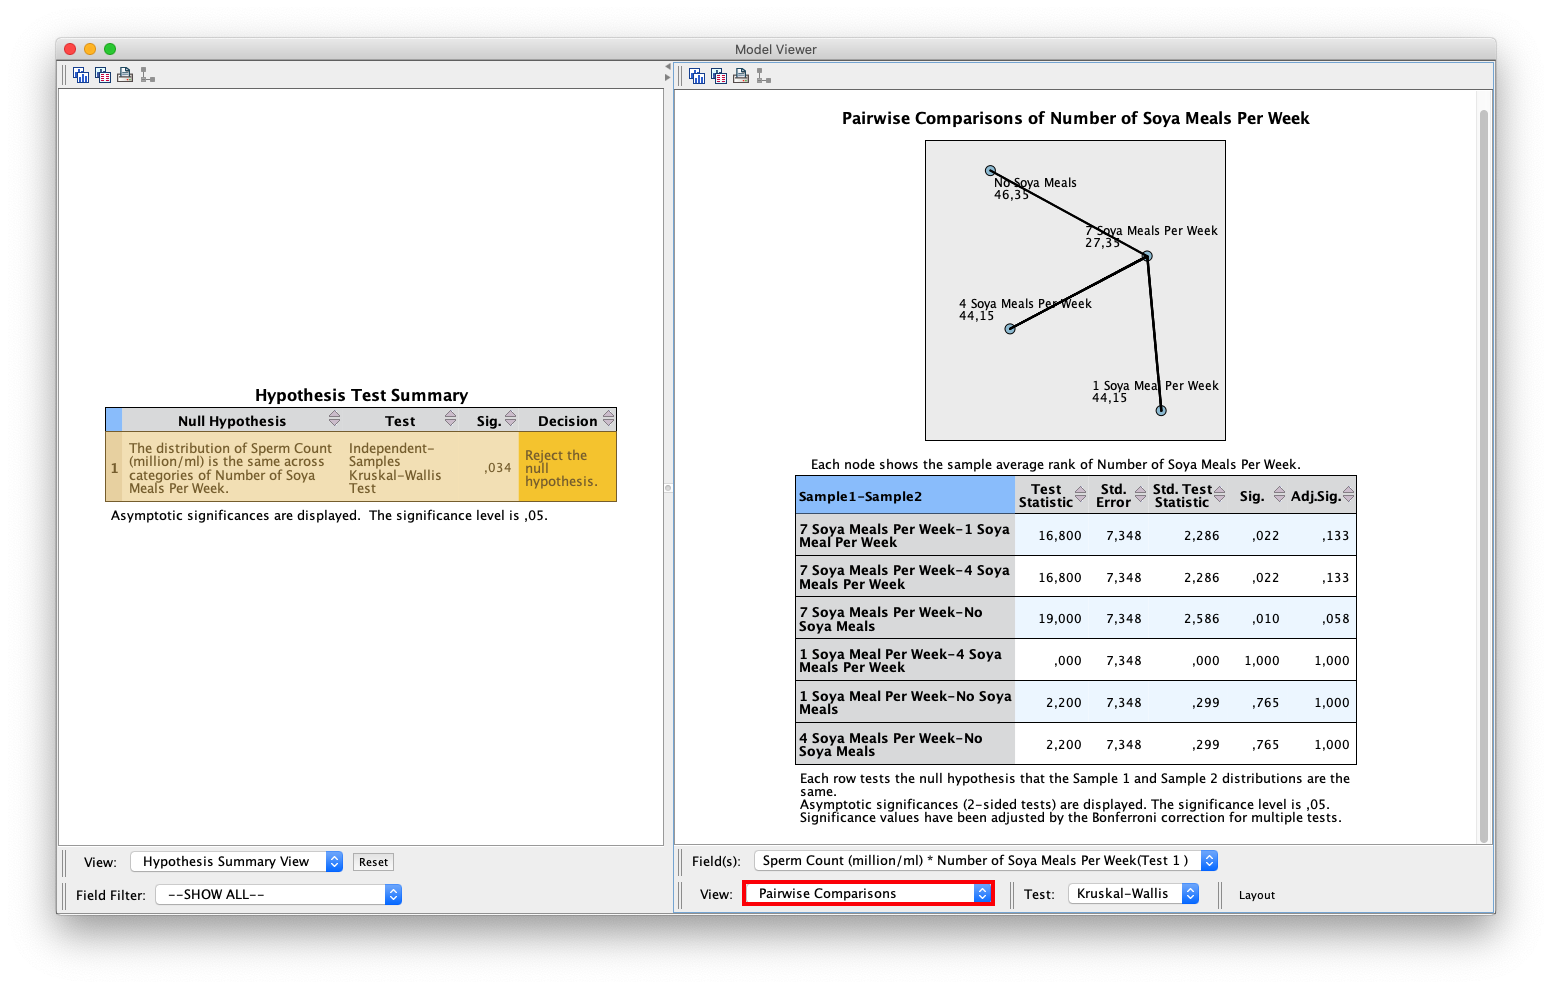
In SPSS, you have to double-click the summary table to get all of the
results. The significance value of the test is found both in the summary
table and in the Independent Samples Test View. You can also find the
Kruskal-Wallis statistic and the degrees of freedom here. |
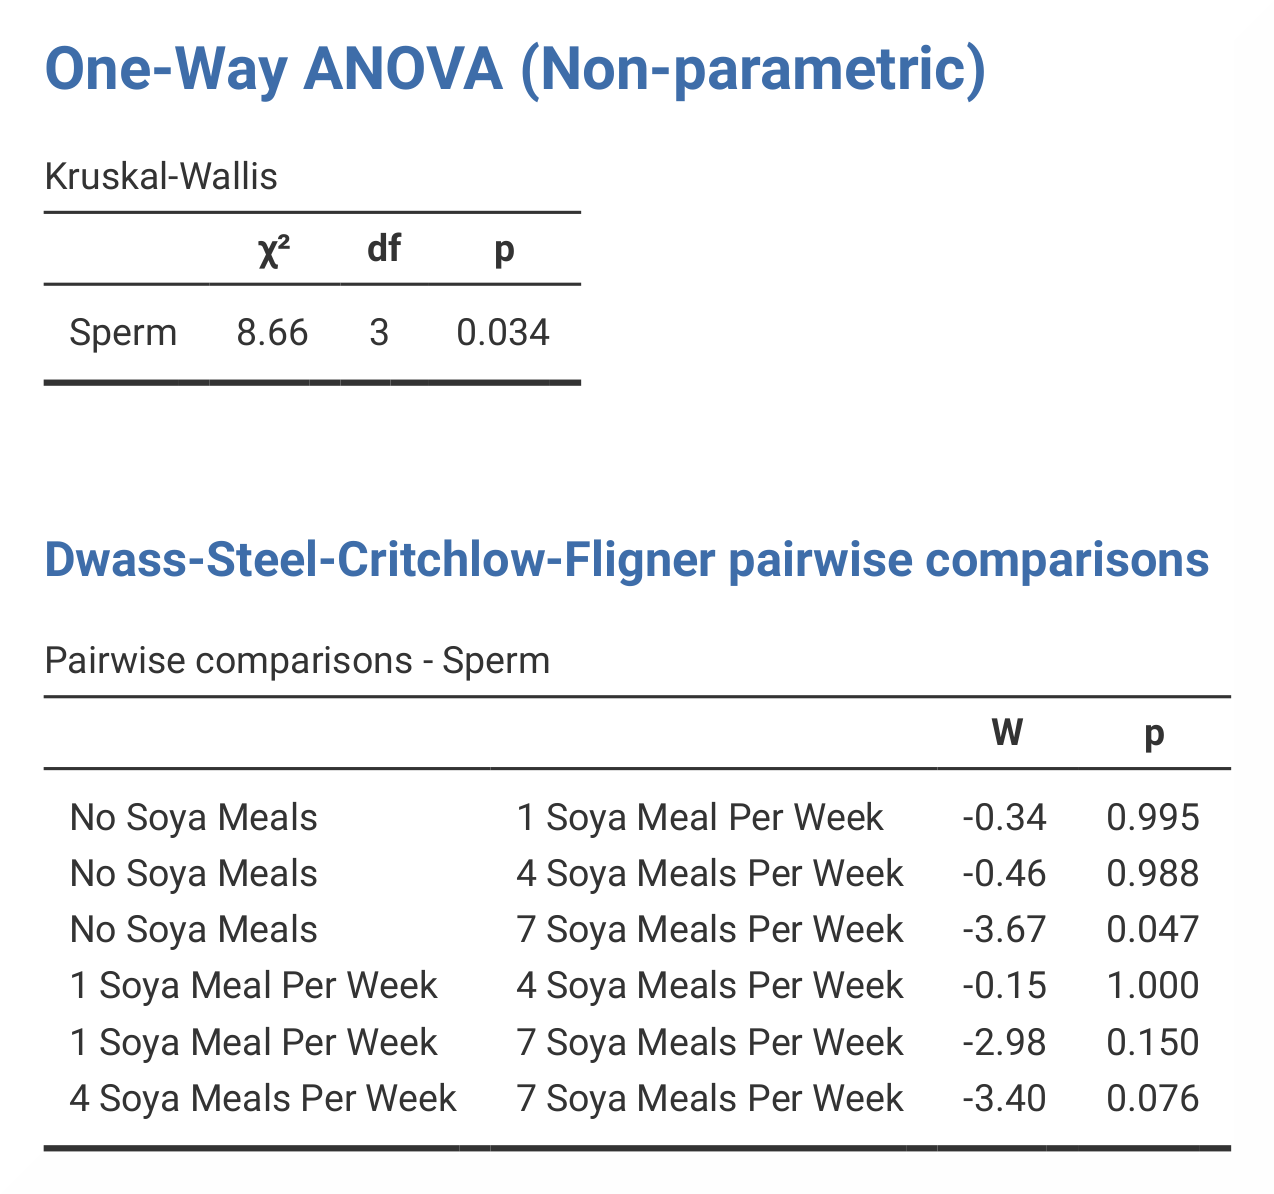
The output in jamovi contains two tables - Kruskal-Wallis and Pairwise
comparisons – Sperm. The Kruskal-Wallis table includes all the same
values that are included in the equivalent table in SPSS, except for the
sample number. The pairwise comparison looks quite different than the one in
SPSS, and only includes a W-value and a p-value. |
The The numerical values from the Kruskal-Wallis test are the same in SPSS and jamovi: H = 8.66, df = 3, p = .034. |
|
| If you wish to replicate those analyses using syntax, you can use the commands below (in jamovi, just copy to code below to Rj). Alternatively, you can download the SPSS output files and the jamovi files with the analyses from below the syntax. | |
NPTESTS
  /INDEPENDENT TEST (Sperm) GROUP (Soya) KRUSKAL\_WALLIS(COMPARE=PAIRWISE)
  /MISSING SCOPE=ANALYSIS USERMISSING=EXCLUDE
  /CRITERIA ALPHA=0.05 CILEVEL=95.
|
jmv::anovaNP(
    formula = Sperm ~ Soya,
    data = data,
    es = TRUE,
    pairs = TRUE)
|
| SPSS output file containing the analyses | jamovi file with the analyses |
References
Field, A. (2017). Discovering statistics using IBM SPSS statistics (5th ed.). SAGE Publications. https://edge.sagepub.com/field5e