この節の作者: Rebecca Vederhus, Sebastian Jentschke
From SPSS to jamovi: Non-parametric analyses
This comparison shows how a Wilcoxon signed-rank test is conducted in SPSS and jamovi. The SPSS test follows the description in chapter 7.5.2 in Field (2017), especially figure 7.9 and output 7.3 - 7.4. It uses the data set Drug.sav which can be downloaded from the web page accompanying the book.
| SPSS | jamovi |
|---|---|
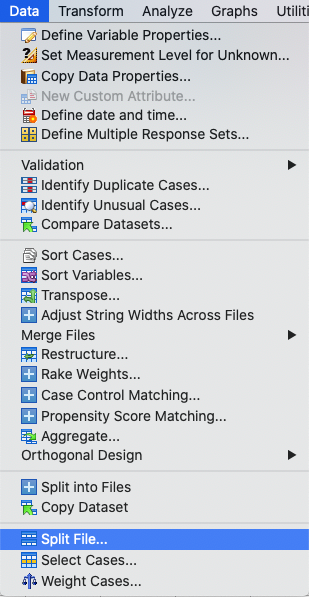
In SPSS, first split the file using Data → Split File. |
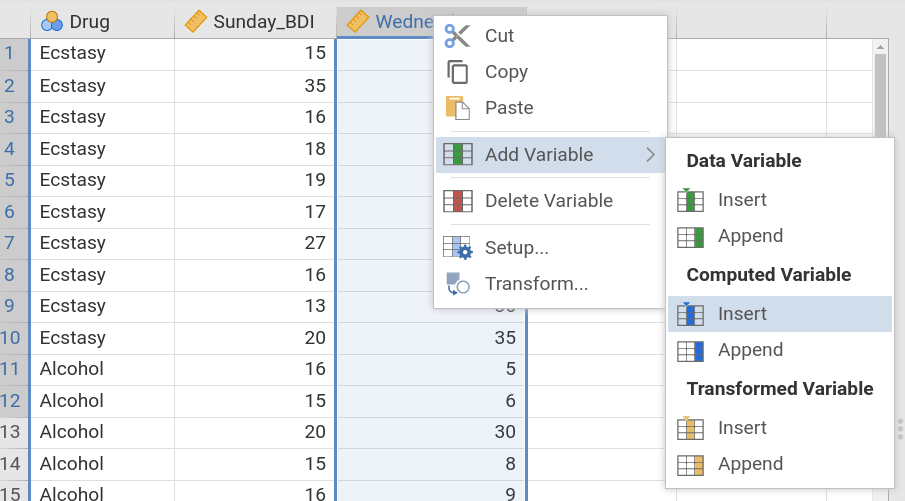
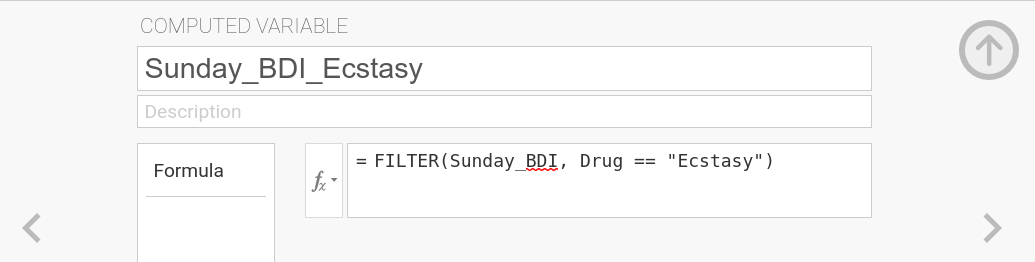
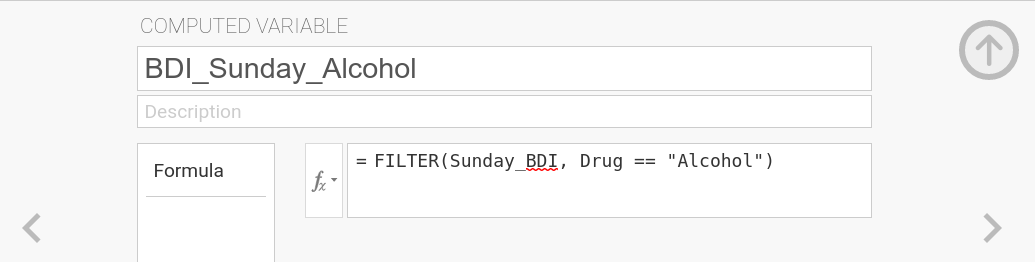
In jamovi, the FILTER()-function can be used to achieve a split. You need
to create two new computed variables (ideally, those variables should be
inserted before Wednesay_BDI). For the first, use FILTER(Sunday_BDI,
Drug == "Ecstasy") as expression to be calculated and name the variable
Sunday_BDI_Ecstasy. For the second, use FILTER(Sunday_BDI, Drug ==
"Alcohol") as expression and Sunday_BDI_Alcohol as name. Please note,
that it is not necessary to split the second variable Wednesday_BDI since
jamovi uses listwise exclusion. |
 |
|
In the Split File window, click Organize output by groups. Then, move
the Drug variable to the box called Groups Based on. Lastly, click
Sort the file by grouping variables. |
|
 |
 |
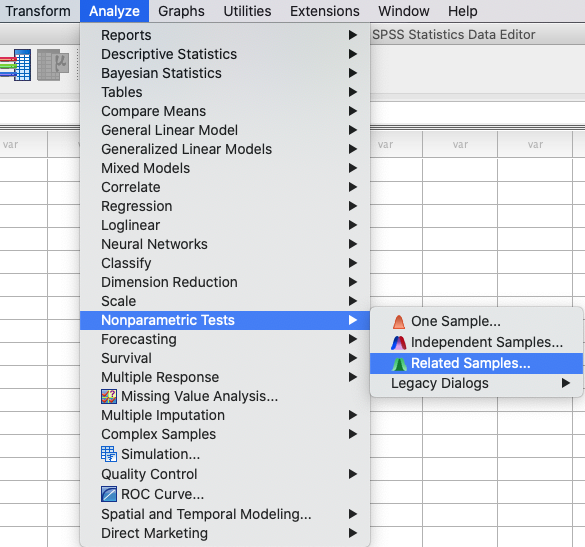
Then, create a Mann-Whitney test using: Analyze → Nonparametric Tests
→ Related Samples. |
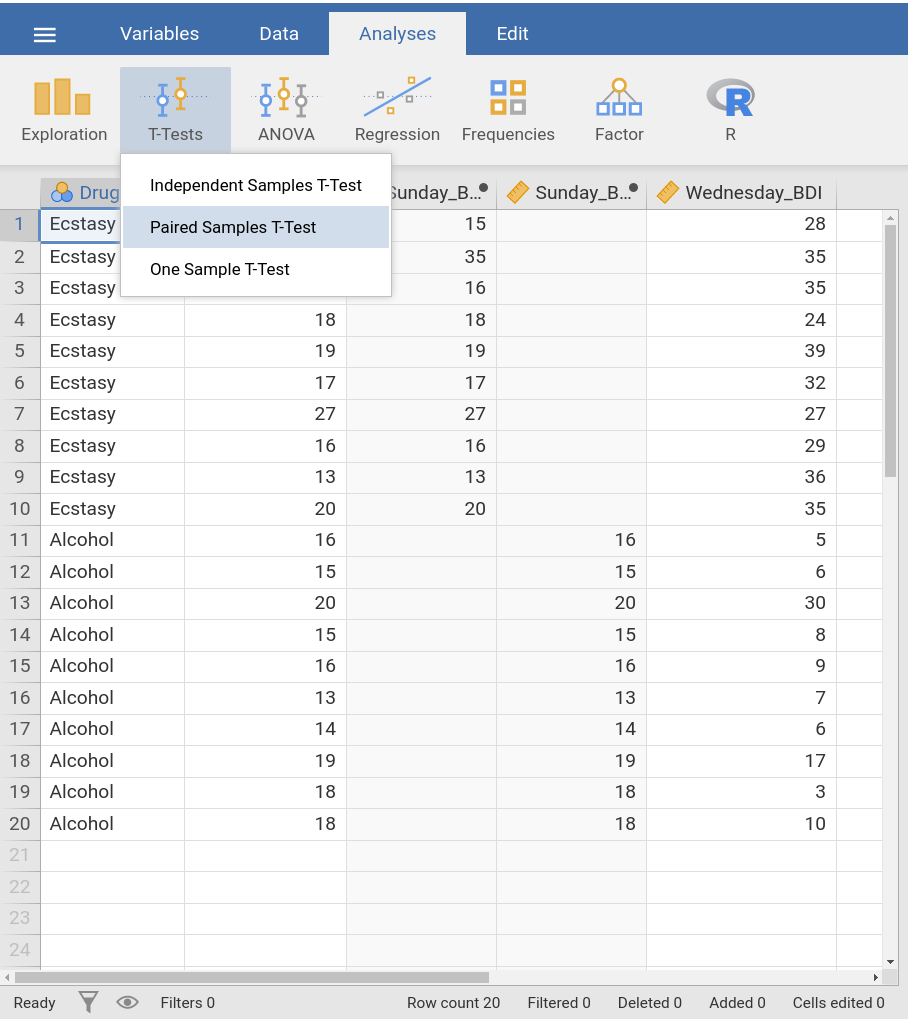
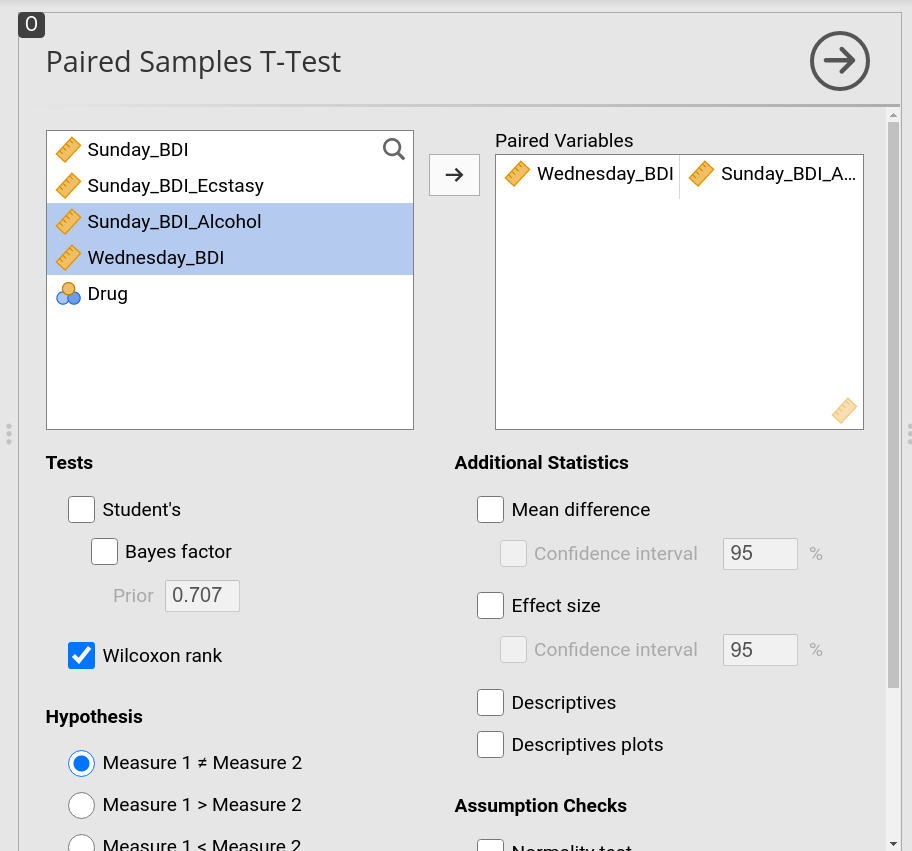
Create a Wilcoxon signed-rank test using: Analyses → T-tests →
Paired Samples T-Test. |
 |
 |
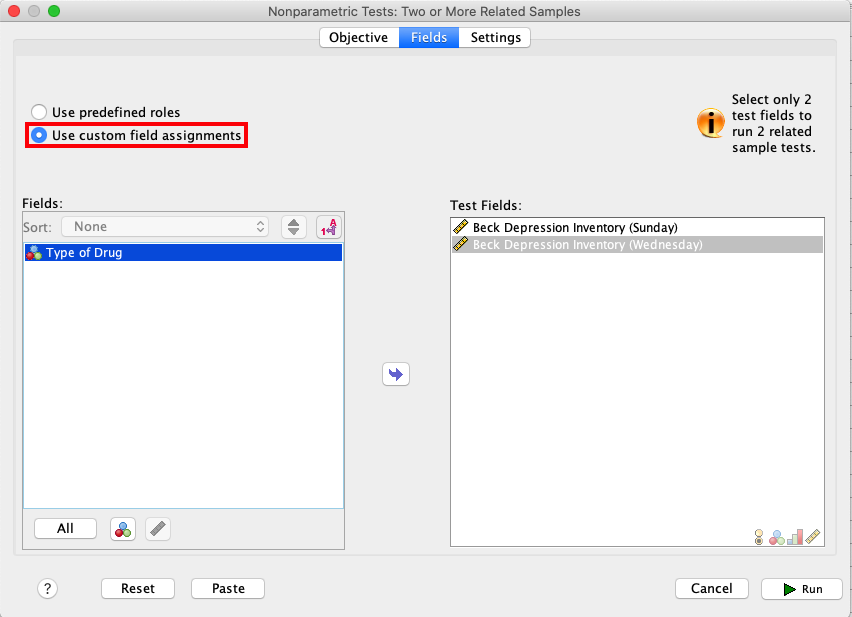
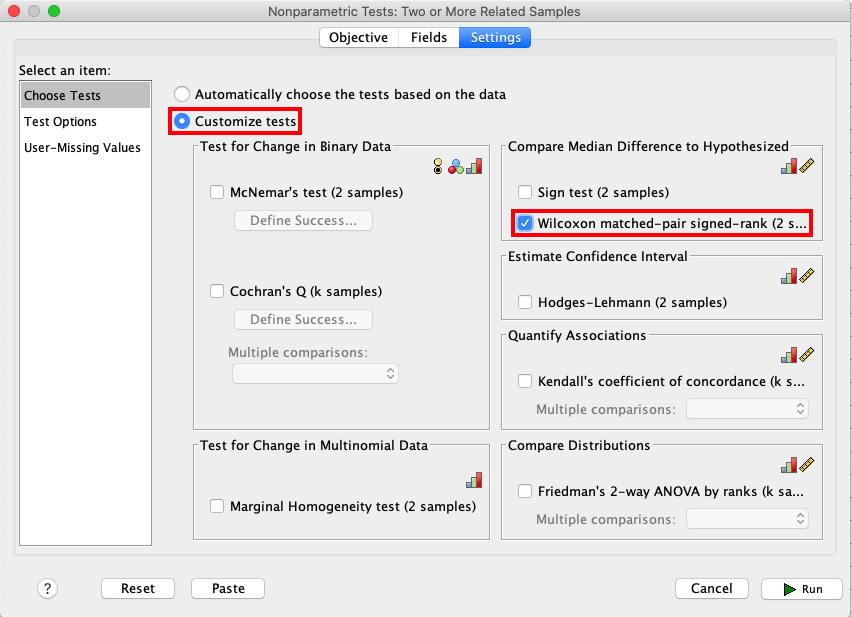
In the Nonparametric Tests window, open Fields and click Use custom
field assignments. Move the Sunday and Wednesday variables to the
Test Fields box. |
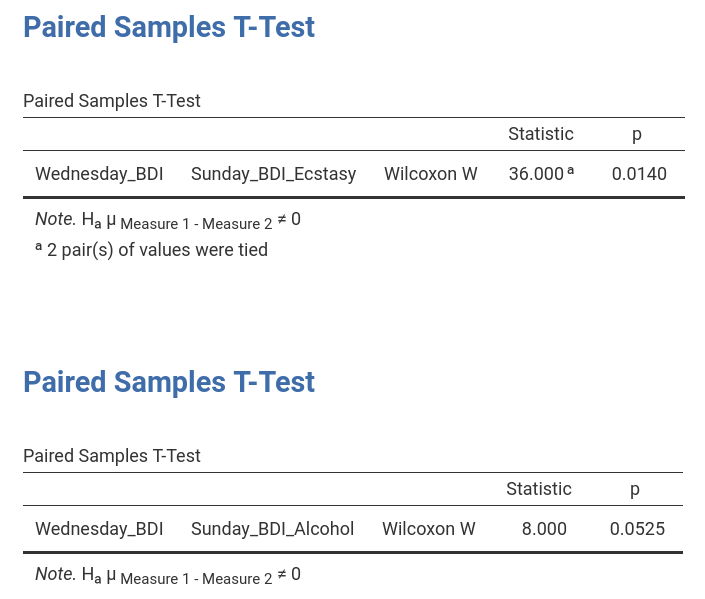
Select Wednesday_BDI and Sunday_BDI_Ecstasy, and move them to the
Paired Variables box. Then, untick Student's and tick the box for
Wilcoxon rank. Afterwards, you can either right-click on the analysis you
just created and select Analysis → Duplicate or repeat the previous
step to set up a new analysis. This time, Wednesday_BDI and
Sunday_BDI_Ecstasy have to be chosen as Paired Variables. |
 |
 |
Lastly, open Settings and click Customize tests. Tick the box for
Wilcoxon matched-pair signed-rank as shown in the picture below. |
|
 |
|
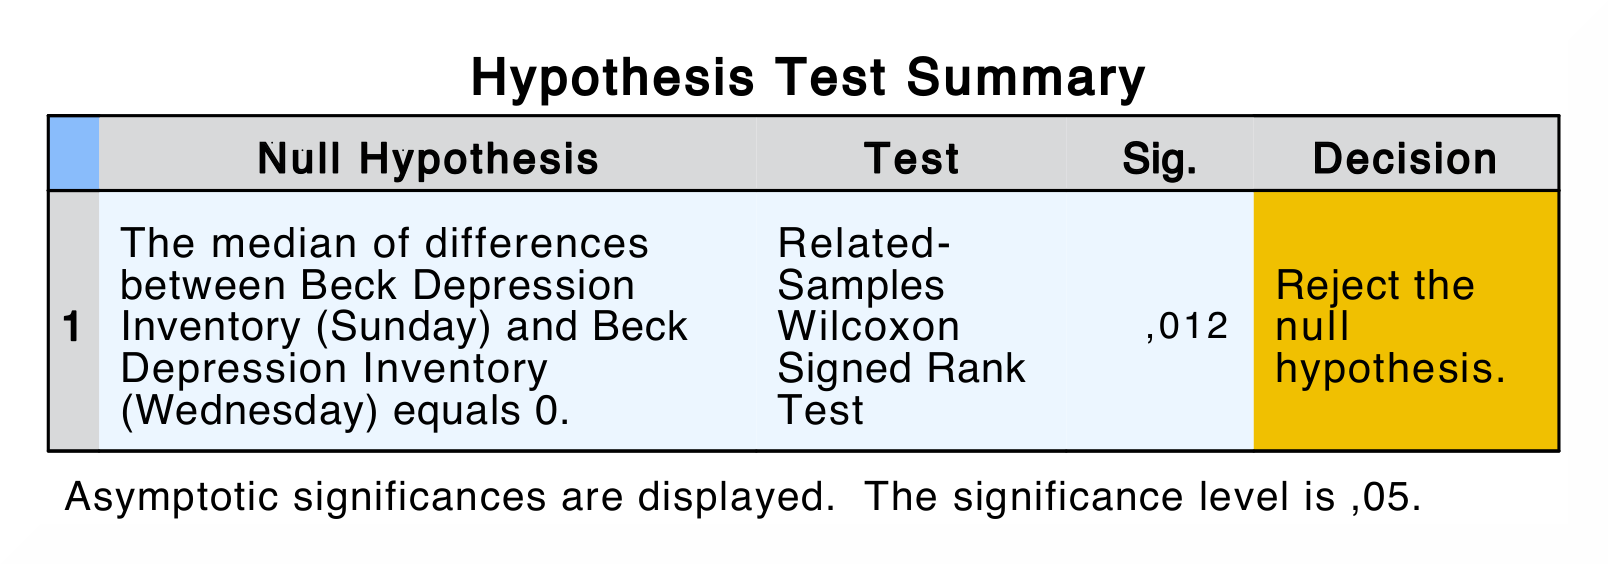
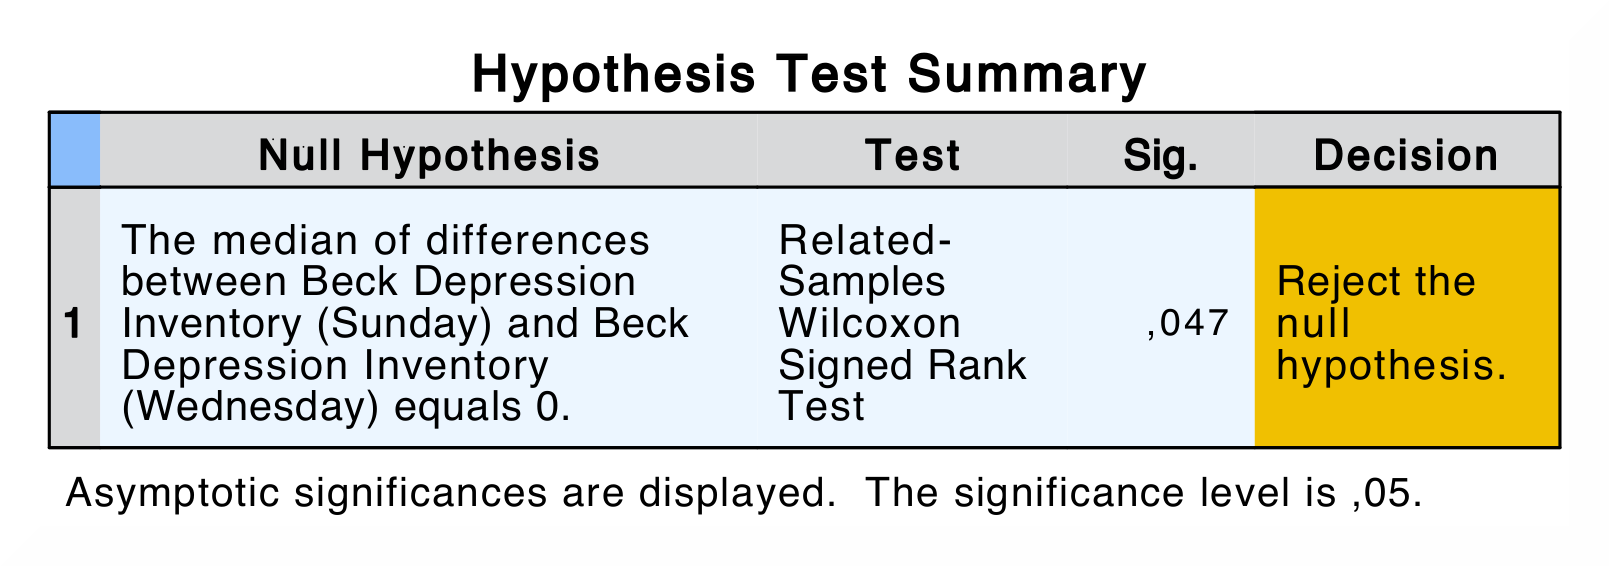
| Comparisons of the output show that the results in SPSS and jamovi are slightly different. | |
 |
 |
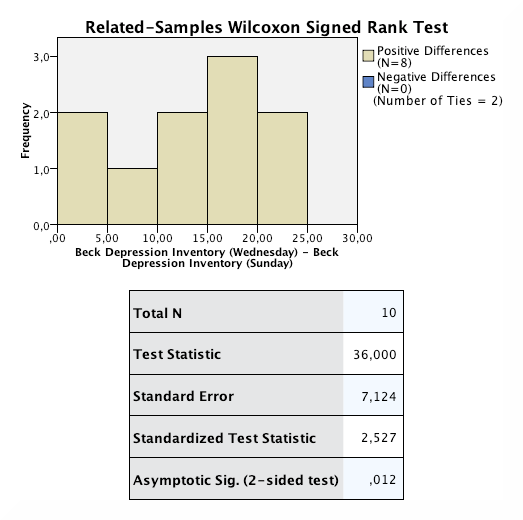
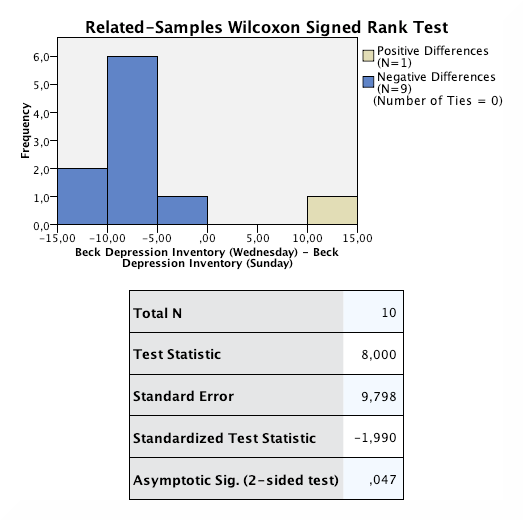
In SPSS, the first output table is the model summary, which only shows the
p-value for the test. If you double-click this table, you get the details
of the analysis (see images underneath). There are two model summaries, on
for each drug condition. The Wilcoxon Signed Rank test show the following
values: Total N, Test Statistic, Standard Error, Standardized
Test Statistic and Asymptotic Sig. (2-sided test). |
Other than SPSS, the Paired Samples T-Test table only displays the test
statistic and its significance value. |
 |
|
| When comparing the output, none of the numerical values for the test statistic are the same. The reason for the difference in p-values is that jamovi applies continuity correction (where a discrete distribution – ranks – is approximated via a continuous one – the standard normal distribution) whereas SPSS doesn't. | |
| If you wish to replicate those analyses using syntax, you can use the commands below (in jamovi, just copy to code below to Rj). Alternatively, you can download the SPSS output files and the jamovi files with the analyses from below the syntax. | |
NPTESTS
   /RELATED TEST(Sunday_BDI Wednesday_BDI) WILCOXON
   /MISSING SCOPE=ANALYSIS USERMISSING=EXCLUDE
   /CRITERIA ALPHA=0.05 CILEVEL=95.
|
jmv::ttestPS(
    data = data,
    pairs = list(
        list(i1 = "Wednesday_BDI", i2 = "Sunday_BDI_Ecstasy")),
    students = FALSE,
    wilcoxon = TRUE)

jmv::ttestPS(
    data = data,
    pairs = list(
        list(i1 = "Wednesday_BDI", i2 = "Sunday_BDI_Alcohol")),
    students = FALSE,
    wilcoxon = TRUE)
|
| SPSS output file containing the analyses | jamovi file with the analyses |
References
Field, A. (2017). Discovering statistics using IBM SPSS statistics (5th ed.). SAGE Publications. https://edge.sagepub.com/field5e